
Learn how to analyze stocks with our easy, 7-step and beginner-friendly guide. See how LevelFields can help you make smart choices.
Trading Strategies
July 26, 2024


Table of Contents
Investing in the stock market is one of the best ways to build long-term wealth, but only if you make informed investment decisions. That means going beyond news headlines and hot tips. You need to understand how to analyze stocks for yourself.
Whether you're a hands-on researcher or rely on tools like AI stock analysis software, learning the basics of stock analysis is essential. You should know what drives stock prices, how to interpret financial statements, and when to buy, hold, or sell.
In this guide, we’ll walk you through seven clear, actionable steps to help you analyze individual stocks with confidence.
Stock analysis is the process of evaluating a company’s financial performance, business fundamentals, and market behavior to guide investment choices.
Whether you're interested in long-term stock investing or short-term trading, learning how to analyze stocks helps you identify opportunities, avoid common risks, and make smarter decisions.
Before you put money into any individual stocks, it’s essential to understand what you’re really buying. Stock analysis helps you decide whether the current stock price reflects the company's profitability, growth trajectory, and position within its industry.
Without doing your own investment research, you risk chasing hype or missing undervalued stocks with strong future prospects.
There are two main ways to analyze stocks:
Fundamental analysis focuses on the company itself: its financial statements, cash flow, earnings, industry trends, and broader economy. It aims to determine the stock’s intrinsic value and compare it to its market price.
Technical analysis, by contrast, focuses on price patterns, trading volume, and technical indicators. It doesn’t ask what a stock is worth. Instead, it tries to forecast future price movements based on past performance and chart patterns.
Many investors use both types of stock analysis for a more complete picture.
You can analyze stocks manually, or speed things up with AI stock analysis software. These tools track market news, financial data, and price activity in real-time, helping you research stocks and evaluate different stocks faster and more efficiently.
No matter your trading approach, strong stock analysis helps you build an investment strategy that aligns with your risk tolerance, time horizon, and goals while considering the overall economy.
Stock analysis isn’t just about watching prices. It’s about understanding the business, assessing its financial health, and evaluating external risks and catalysts.
Here are seven useful steps for analyzing stocks.
Before you dive into technical indicators or financial metrics, start with the basics: what does the company actually do and what fundamental factors influence its operations?
Explore the company’s core operations. What products or services does it offer? How does it generate revenue? Understanding its business model gives you the context to evaluate whether its income statements and cash flow make sense.
Identify the company’s primary customers. Are they individuals, businesses, or institutions? A company’s customer base influences sales stability and market potential.
Research the company’s industry and direct competitors. Look for a competitive edge, such as proprietary technology, brand loyalty, or efficient supply chains, that supports long-term profitability.
Ask whether the business can grow without drastically increasing costs. Look for factors like digital products, international expansion, or high margins. If the business lacks scalability, its growth trajectory may be limited.
Understanding the company at this level lays the foundation for deeper stock analysis and a solid investment strategy alongside informed investment choices.
Next, dig into the financial statements to evaluate the company’s health and performance.
The income statement shows how much the company earns, spends, and keeps as net income, which is a key part of the company's financial statements.
Focus on trends in revenue and profitability. Is revenue growing steadily? Are margins shrinking? This helps you analyze both past performance and potential future results.
The balance sheet outlines assets, liabilities, and shareholder equity. Key metrics include current assets, debt levels, and liquidity ratios.
Companies with strong balance sheets are more resilient during downturns and have more flexibility to invest in growth.
This shows how much cash the company generates from operations, investments, and financing.
Positive operating cash flow is critical, especially for dividend-paying stocks or companies with ambitious expansion plans.
Look for warning signs like declining earnings per share (EPS), negative free cash flow, or rising debt. These may indicate the company’s financial performance is slipping, even if the current price looks appealing.
A stock’s value is largely tied to how much money the company earns and whether that figure is growing.
First of all, you should understand EPS. It’s a measure of profitability per share. Rising EPS over time often signals a well-managed, efficient business. Compare current EPS to previous quarters to spot trends.
Then, track revenue growth as it’s a key indicator of demand. Look at whether the company’s sales are rising steadily. Compare this growth to industry benchmarks and competitors.
Revenue growth doesn’t mean much if the company’s costs are growing faster. Always check whether increased revenue translates into better profitability and stronger earnings.
Valuation ratios help you decide whether a stock is fairly priced compared to its peers or past performance.
This ratio compares the stock’s current price to its EPS. A high P/E might suggest overvaluation, or strong growth expectations, and it’s important to assess fair value in this context.
A low P/E could indicate an undervalued stock, but also may signal investor concerns.
This compares the stock’s price to its net asset value. A P/B under 1 may point to an undervalued company, especially in asset-heavy industries.
The P/S ratio shows how much investors pay for every dollar of revenue. It’s useful for evaluating early-stage or unprofitable companies.
Use these ratios in context with the company’s financial statements, industry norms, and broader economic conditions.
Beyond the numbers, you need to evaluate the company’s position in its industry and its ability to fend off competitors.
Companies with dominant market share often benefit from economies of scale, pricing power, and customer loyalty.
A sustainable competitive advantage, or moat, can come from things like patents, proprietary software, exclusive partnerships, or cost advantages. Companies with durable moats are more likely to grow consistently over time.
Finally, in such fast-changing industries, agility is a strength. Consider how the company responds to innovation, shifting customer needs, or economic cycles.
A company doesn’t operate in a vacuum. The industry and broader economy play a big role in how individual stocks perform. That’s why you should review industry and economic conditions.
Is the company in a growing sector? How is it affected by new regulations or disruptive technologies? Studying the company's industry can help spot opportunities and sectors in decline.
Next, watch for changes in interest rates, inflation, and consumer spending. These factors, along with other factors, can impact company earnings and stock prices.
For example, rising interest rates may hurt businesses with heavy debt loads, while strong Gross Domestic Product (GDP) growth may boost retail and tech stocks.
Keeping an eye on insider and institutional investor behavior can give you an edge in analyzing stocks.
When executives and board members buy shares, it may signal they believe the stock is undervalued. On the flip side, unexpected or frequent insider selling can be a red flag.
Institutional investors often have access to deep research reports and analyst insights. Their buying and selling activity, reported in 13F filings, can reveal how the pros view a given stock.
Use this data as a secondary layer in your investment research to spot confirmation bias and validate your own analysis.
If you're evaluating stocks, don’t just glance at the price and call it a day. To make smart investment decisions, you need to look at the key statistics that actually reflect how a stock is performing, and how it might behave in the future.
These metrics help you compare specific stocks side by side and assess their potential for long-term growth or short-term movement.
A stock trading at $30 isn’t automatically more affordable or less valuable than one trading at $300. The real question is what you’re getting for that price.
That’s where deeper analysis of the company's business performance comes in.
Look at EPS to understand profitability, and use the P/E ratio to determine how much you're paying for each dollar of profit. A lower P/E ratio can point to an undervalued opportunity, but only if the company’s fundamentals are strong.
Also check trends in revenue and profit growth. Consistent improvement in these areas often signals positive future price movements.
Context matters. Always evaluate a stock’s performance against similar companies in the same sector. Comparing key statistics like market capitalization, profit margins, or return on equity can show whether the business is leading the pack or lagging behind.
Each particular company will have different levers of growth. For some, it's product innovation; for others, it's pricing power or international expansion.
The more you understand the company’s core drivers and business performance, the better you can anticipate where the stock is headed in the context of evaluating stocks.
When you base your analysis on meaningful, comparable data, you’re not just following the crowd. You’re thinking like an active investor.
Learning how to analyze stocks is only the beginning. Execution is where real results happen.
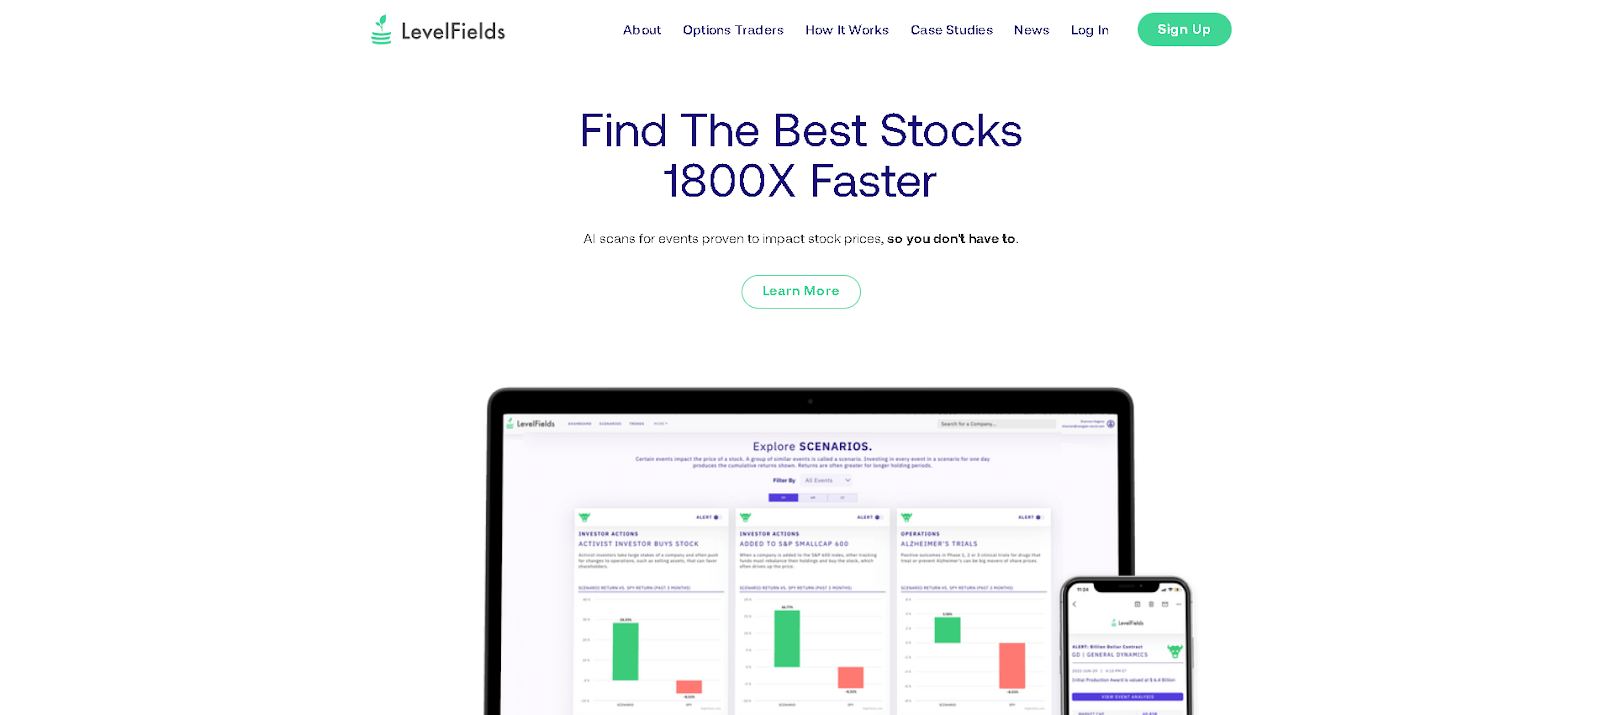
LevelFields simplifies this process with AI-powered investing tools that remove guesswork and streamline your stock analysis workflow. Whether you're evaluating a company’s past performance, tracking dividend yield, or reviewing research reports, LevelFields delivers the insights you need, fast.
The platform scans financial filings, price activity, and market events to flag trade-worthy opportunities. It helps you research stocks based on a company’s earnings, business overview, and future results, without getting lost in clutter or confirmation bias.
With customizable filters and real-time alerts, LevelFields adapts to your trading approach, investment goals, and preferred strategies.
Instead of jumping between multiple tools, you can consolidate further research, identify under-the-radar opportunities, and act on them confidently, all in one place.
Ready to take your investment choices to the next level? Get started with LevelFields and bring clarity to your stock analysis.
The best approach combines fundamental analysis and technical analysis.
Start with a business overview, and review the company’s profitability, earnings, growth trajectory, and dividend yield. Then move to chart patterns, volume trends, and price history. Cross-reference this with research reports, market sentiment, and broader economic indicators.
Tools like LevelFields can help consolidate these layers into a clear picture.
The 7% rule is a risk management strategy that helps protect your capital. It suggests exiting a trade if the stock drops more than 7% below your entry price. This keeps potential losses small and avoids emotional decision-making.
While useful, it’s best used in context, with further research into past performance, business fundamentals, and industry trends.
The 10 a.m. rule refers to avoiding trades in the first 30 minutes of the market open, when volatility is often highest. Many individual investors wait until after 10 a.m. to let the market settle before committing to a position.
This approach helps reduce noise and false signals, and it's especially useful for technical analysts using chart-based strategies.
The 3-5-7 rule is a simple guideline to manage risk and reward:
This structure encourages discipline and makes sure your investment choices are aligned with long-term portfolio growth and risk tolerance.
Join LevelFields now to be the first to know about events that affect stock prices and uncover unique investment opportunities. Choose from events, view price reactions, and set event alerts with our AI-powered platform. Don't miss out on daily opportunities from 6,300 companies monitored 24/7. Act on facts, not opinions, and let LevelFields help you become a better investor.

AI scans for events proven to impact stock prices, so you don't have to.
LEARN MORE