
6 Best Stock Analysis Software Tools in 2025: 1. LevelFields 2. TrendSpider 3. Ziggma 4. BlackBoxStocks 5. TuringTrader 6. E*TRADE.
AI
February 11, 2025


Table of Contents
The stock market is full of opportunity, but only if you have the right tools to make sense of the data. Traditional research methods often struggle to keep up with fast-moving trends and massive volumes of market data.
That’s where stock analysis software steps in.
Once reserved for institutional investors, these tools now give individual traders access to real-time market data, advanced stock market analysis tools, and automated monitoring to improve portfolio performance. By analyzing historical data, identifying technical patterns, and generating predictions, traders can move faster and make smarter decisions.
Need one for your portfolio? In this article, we'll cover the top six contenders for the best stock analysis software you can use.
Stock analysis software is a digital tool designed to help traders and investors evaluate stocks more efficiently. By analyzing market data, such as stock prices, trading volume, and financial data, the software helps you identify trends, spot opportunities, and improve your trading strategies.
Some platforms rely on manual inputs and preset indicators, while others use AI-driven insights to adapt and learn from new data. Many tools include advanced charting, real-time data, and technical indicators to support informed investment decisions.
Key features include:
Whether you're investing for the long term or trading short term, this software can sharpen your edge.
Stock analysis tools are transforming the way traders and investors interact with the stock market. Whether you're a swing trader, options strategist, or long-term investor, the right platform can give you a serious edge.
Here are six of the best platforms to consider.

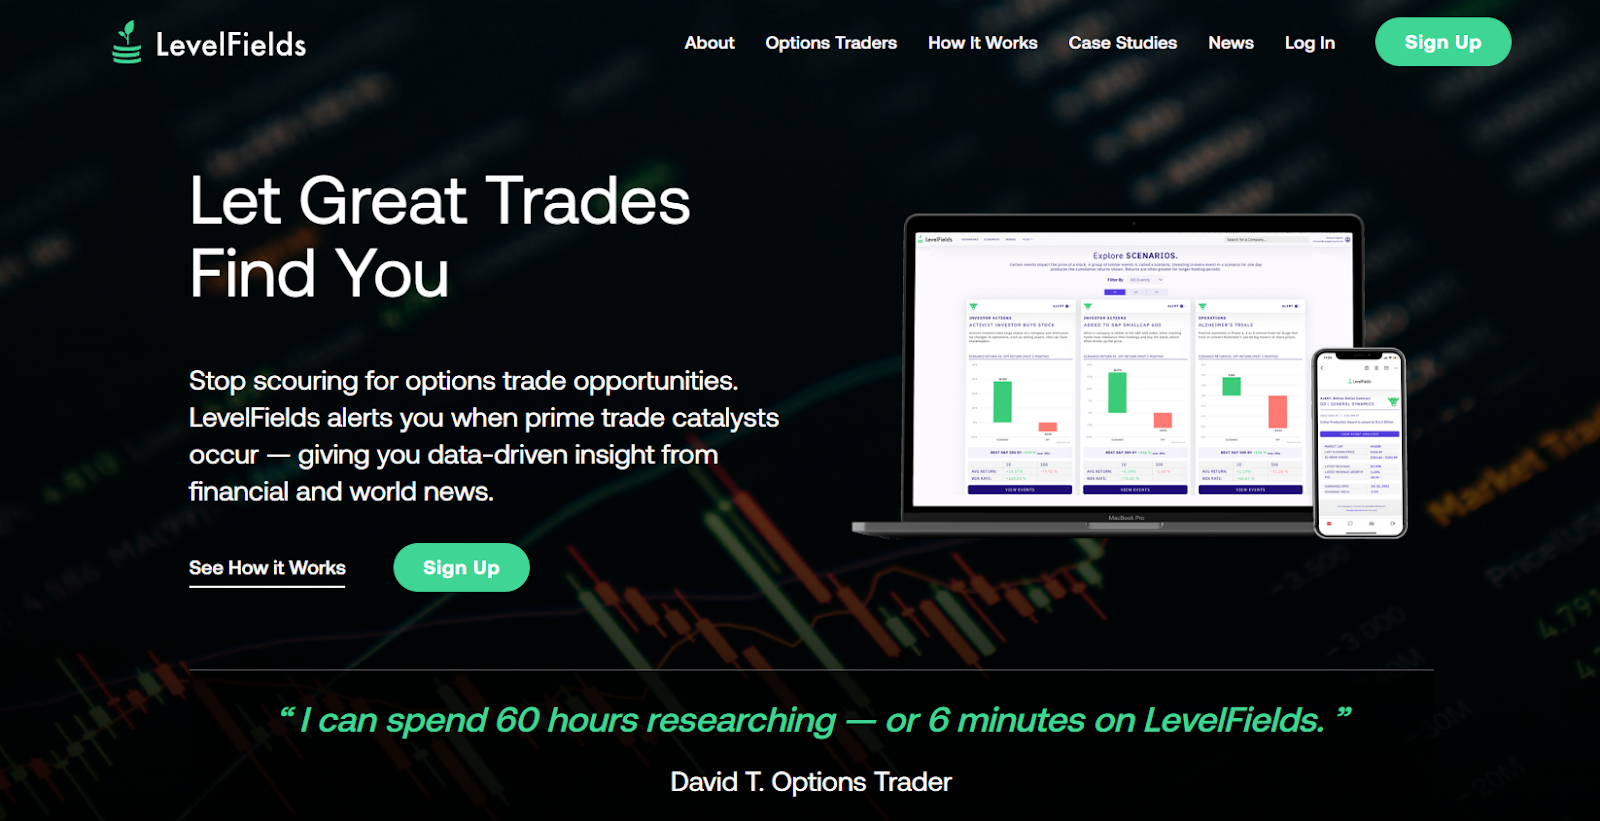
LevelFields is a powerful AI stock analysis software tool designed to help you find trade-worthy events before the market fully reacts through:
LevelFields scans financial filings, regulatory news, and market activity from 6,300+ stocks. It’s built to detect corporate events like CEO changes, layoffs, merger announcements, earnings surprises, and more, all of which can influence a company’s stock price.
The platform alerts you when a stock matches a predefined strategy, allowing you to act on high-probability trades with confidence.
LevelFields is one of the only platforms with over 100 built-in event-driven trading strategies, which gives you the tools to match real-time data with your unique investment strategies.
From hedge funds to retail traders, anyone can benefit from these playbooks, whether you’re chasing short-term movement or positioning for long-term gains.
Before jumping into a trade, LevelFields shows you how similar events impacted stock performance in the past. You'll see historical price movements, win/loss ratios, average returns, and event-specific trends, which are all essential to making informed investment decisions.
Whether you prefer long-term investing or nimble short-term plays, LevelFields adapts to your trading style with two membership tiers:
If you’re looking for the best stock analysis app with an emphasis on real-world market catalysts, LevelFields gives you:
From spotting emerging trends to executing trades around news-driven volatility, LevelFields is built for serious traders who want data-backed, actionable insights without spending hours in research.
Ready to make better trades with AI? Sign up for LevelFields today.

TrendSpider is an AI-powered technical analysis platform built for traders who want speed, accuracy, and flexibility. Whether you're trading stocks, ETFs, or crypto, it helps you stay ahead of market trends by automating charting, backtesting, and trade execution.
It’s a suitable choice for active traders and advanced users who want data-driven precision without coding.

Ziggma is designed for investors who want to simplify portfolio management while gaining deeper insights into their investment strategies. By consolidating multiple brokerage accounts into one clean interface, Ziggma makes it easier to track portfolio performance, manage risk exposure, and make informed investment decisions.
It’s useful for long-term investors focused on diversification and asset allocation.

BlackBoxStocks is a dynamic platform built for active traders who want real-time market data, community-driven insights, and powerful tools to track stock prices, options flow, and market activity.
It combines smart trading strategies with institutional-grade tools and social collaboration to help you spot trading opportunities as they emerge.

TuringTrader helps you build diversified portfolios with a focus on risk management and consistent performance. Whether you're aiming for long-term growth or income, this platform uses quantitative analysis and historical data to recommend personalized investment strategies that match your goals and risk tolerance.

Power E*TRADE offers an intuitive yet powerful trading platform built for serious traders. Whether you're into stocks, ETFs, options, or futures, it brings everything under one roof. With robust technical analysis, customizable layouts, and fast execution, it helps you turn trade ideas into action without the clutter.
Great stock analysis software gives you the edge to make smarter investment decisions. Whether you’re evaluating stocks for a long-term portfolio or spotting trends for short-term trades, these tools are built to simplify complex data, highlight key insights, and help you act with confidence.
Here’s a breakdown of the most valuable features.
Access to real-time market data is essential. These platforms stream stock prices, trading volumes, and market activity as it happens, so you’re never operating on outdated information.
Instead of guessing, you’re making moves based on what’s actually unfolding in the stock market. Real-time updates also help you respond faster to price swings or volume surges, giving you a leg up in volatile market conditions.
Top platforms use technical analysis to help you identify technical patterns in historical price data. Think breakouts, reversals, consolidations: the moments that often precede major price shifts.
Recognizing these patterns helps you anticipate price movements and align your trading strategies with what the market is signaling. For traders, this means fewer surprises and more targeted entries and exits.
Beyond numbers, sentiment matters. Some tools analyze news articles, social media chatter, and financial reports to gauge market sentiment. Is the market optimistic or cautious about a stock?
This feature helps you understand how other investors, retail and institutional, are reacting to recent events. It’s a smart way to catch emotional momentum or avoid hype-driven risk.
Modern stock analysis software integrates with your trading platform or brokerage account, so you can analyze, decide, and execute trades in one place.
This workflow efficiency saves time and prevents you from missing key opportunities while switching between apps. But integration also brings risks, especially during high-volatility moments, so make sure the platform is stable under pressure.
Want to know when a stock breaks out or hits a price target? Custom alerts help you set specific triggers based on price changes, unusual volume, or market trends.
You’ll get notified the moment your conditions are met, meaning you don’t need to watch charts constantly. Alerts help you act faster, stay focused, and make informed decisions even when you’re away from the screen.
Predictive modeling uses historical trends, market data, and AI-driven insights to forecast potential future performance.
These features help traders evaluate what might happen next based on what’s already occurred, helping reduce emotional trading and support data-driven decisions. It’s especially useful for spotting stock ideas before the crowd catches on.
Knowing when to trade is just as important as knowing how much to risk. Many platforms offer tools to assess portfolio risk exposure, optimize position sizes, and keep your strategy within your risk tolerance.
You’ll see how changes in your asset allocation could impact your performance, so you’re never caught off guard. These tools are critical for building long-term investments that can weather market shifts.
Charts, graphs, and dashboards for data visualization bring your financial data to life. Instead of staring at spreadsheets, you get clean visual summaries of trends, volume surges, or portfolio changes.
This feature makes complex analysis simpler and faster. Whether you're tracking historical performance or evaluating a new setup, visual clarity helps you act with greater conviction.
Finding the best stock analysis software isn’t just about having access to fancy charts or algorithms. It’s about choosing the tool that fits your trading goals. Whether you’re a beginner building confidence or an experienced trader optimizing your investment strategy, the right platform makes all the difference.
Here’s how to make the smartest choice.
Before comparing tools, be clear on your investment goals. Are you focused on short-term stock trading or building a diversified portfolio for the long run?
For active traders, real-time technical analysis, alerts, and trade ideas are critical. If you're a long-term investor or financial advisor, you’ll want tools that evaluate company fundamentals, analyze cash flow and economic indicators, and support portfolio monitoring.
Knowing your style helps filter out software that may be feature-rich but not useful for your needs.
Don’t settle for hype. Check whether the software truly helps you analyze stocks effectively.
You should be able to track market changes and live data points, identify patterns in price movements, and use a stock screener to filter by valuation or performance.
Your tool should also make it easier to customize alerts, set personal watchlists, and access trendlines, indicators, and drawing tools for deeper analysis.
Make sure it includes all the tools you need to make timely, informed decisions, not just bells and whistles.
A user-friendly interface can dramatically improve how you interact with your analysis tool. It should feel intuitive whether you’re a first-time investor or a data-savvy pro.
Look for clean dashboards, customizable views, and visuals like valuation metrics, charts, or overlays. Bonus points if the software offers in-platform educational resources to sharpen your skills.
The easier it is to find and understand information, the faster you’ll move from data to decisions.
When you sync your trading account or upload financial info, security matters. Choose platforms that offer two-factor authentication, encrypted data storage, and clear privacy policies.
You should never have to trade security for convenience. A reputable platform will be transparent about how your data is stored and used, and it won’t cut corners.
Even the most intuitive software hits snags. That’s why you need responsive support.
Look for live chat or email help, a searchable help center, and regular feature updates based on market trends.
Platforms that evolve frequently reflect a team invested in improving functionality and responding to real user feedback.
Not all great software comes with a hefty price tag, but the free version should still deliver valuable insights. Check whether the platform’s pricing matches the feature set you need.
For example, if you're only using it to backtest your own formulas, a free plan might be enough. But if you need real-time alerts and stock screeners with advanced technical analysis, a premium plan could be worth the investment.
Finally, check what others are saying. Other individual investors, traders, or financial advisors can offer real-world feedback on a platform’s strengths and flaws.
Look for mentions of accuracy, customer service, and whether the tool helped them spot trade ideas they would’ve otherwise missed. Honest reviews are often more valuable than marketing claims.
If you're looking for the best stock analysis software that goes beyond generic charts and scans, LevelFields is your advantage.
Built for individual investors, options traders, and all other types of investors, it uses AI to detect events that drive price movement, giving you valuable insights before the rest of the market reacts.
Whether you're managing long-term investments or seizing short-term momentum trades, LevelFields helps you stay ahead of market trends and market volatility. You’ll get instant access to curated trade opportunities, predictive analytics, and tools that support informed decisions with confidence.
Ready to analyze smarter and trade better? Try LevelFields now.
The best stock analysis software depends on your trading style and goals, so it's important to look for features that help you analyze market trends, assess risk, and make informed decisions.
For event-driven traders, LevelFields is ideal.
The 7% rule is a stock trading strategy where traders set a stop-loss at 7% below their purchase price. This helps limit downside risk during periods of market volatility, especially for individual investors. It’s a simple but effective rule to protect your capital.
Both technical analysis and fundamental analysis have their strengths.
Technical analysis is useful for short-term trades and identifying patterns in market trends. Meanwhile, fundamental analysis helps assess the long-term value of a stock.
Many successful investors use a mix of both to make informed decisions.
There’s no single "best" stock analyst, but those who consistently provide valuable insights based on data, trends, and macroeconomic factors tend to earn trust.
Tools like LevelFields can help you access analyst-grade insights without needing to follow just one person.
Join LevelFields now to be the first to know about events that affect stock prices and uncover unique investment opportunities. Choose from events, view price reactions, and set event alerts with our AI-powered platform. Don't miss out on daily opportunities from 6,300 companies monitored 24/7. Act on facts, not opinions, and let LevelFields help you become a better investor.

AI scans for events proven to impact stock prices, so you don't have to.
LEARN MORE