
7 Best Stock Market Analysis Tools: 1. LevelFields 2.TradingView 3. Zacks 4. Seeking Alpha 5. Stock Rover 6. Benzinga Pro 7. Thinkorswim
Trading Options with AI
March 5, 2025


Table of Contents
Professional investors and traders rely on stock market analysis tools to study financial trends, track stock performance, and find investment opportunities.
These tools provide access to real-time data, historical performance, and technical indicators that support smarter investing decisions.
Whether you're a value investor, a financial advisor, or an institutional trader, strong research leads to success. The right stock analysis platform can share actionable insights that help you improve trading strategies.
In this article, we will review the best stock market analysis tools, their features, and how they help investors evaluate individual stocks, screen for stock ideas, and track market data.
Finding the right stock market analysis tool depends on how you plan to analyze stocks and make investment decisions. Here are the most important features to consider:
Stock prices go up and down throughout the trading day. Having easy access to real-time data empowers you to react quickly to market shifts.
Real-time data helps you:
Some platforms also provide real-time alerts to notify users when a stock moves beyond a set price range. It helps you monitor investment portfolios without constantly checking prices.
In contrast, delayed data can result in missed opportunities, especially for traders who rely on timing.
Investors use stock screeners to narrow down a large list of stocks based on specific criteria. A stock screener allows users to filter stocks by financial ratios, sector, market capitalization, and performance over time.
The ability to screen and pick stocks that match specific investment goals makes this one of the most useful features of a stock market analysis tool.
Price charts are a key part of stock research, especially for traders who use technical indicators to predict market trends.
A good stock market analysis tool should provide various charting options to help study price movements over different time frames.
Many platforms allow you to apply technical indicators to your figure charts, such as:
These indicators help you decide when to buy or sell a stock based on past price movements.
Advanced platforms also allow other investors to create their own formulas for analyzing stock prices and predicting future price movements.
Investors who focus on fundamental analysis study a company’s financial records before investing.
A good stock analysis website offers access to income statements, balance sheets, and cash flow statements.
Many tools also provide access to SEC filings, which include quarterly and annual reports filed by publicly traded companies. These earnings reports give investors a detailed look at a company’s assets, revenue, expenses, and overall financial position.
Stock prices are influenced by more than just financial performance. News reports, earnings announcements, and investor sentiment all play a role in market movements.
A strong stock analysis platform provides access to:
Some platforms use artificial intelligence to scan thousands of news articles and social media posts to gauge overall investor sentiment.
Tracking investor sentiment helps you make more informed decisions by considering factors beyond financial data.
Investors who develop their own trading strategies use backtesting tools to see how those strategies would have performed in the past.
These tools allow users to apply a set of buying and selling rules to historical data to check for patterns that could indicate future success.
For example, a trader might create a rule to buy stocks when their price crosses above a 50-day moving average and sell when it drops below a 200-day moving average. Running this strategy on past stock price data will show whether it would have resulted in a profit or loss.
Backtesting helps you improve your trading strategies before applying them in real trading. It also allows you to compare multiple trading systems to see which performs best under different market conditions.
The stock market moves quickly, and staying updated on price changes, earnings reports, and breaking news is important for investors.
Many stock market analysis tools provide customizable alerts that notify users when a:
Some platforms send notifications through mobile apps to keep traders informed even when they are away from their computers.
Options trade alerts can be set up for specific stocks, mutual funds, or entire market sectors, which helps investors react to changes as they happen.
Managing an investment portfolio requires more than just tracking stock prices.
The right stock market analysis tool should provide a clear overview of an investor’s holdings, including gains, losses, and overall performance.
Look for risk assessment features that reveal how much risk you are taking with your investments.
Some trading software platforms provide risk scores for individual stocks to help you decide if a stock fits your investment strategy. Others offer historical volatility data to show a stock’s price fluctuations over time.
A well-designed portfolio tracking feature helps individual investors stay organized and make adjustments as needed.
Here are the best stock market analysis tools to consider. Each platform offers unique features designed for different investment styles, whether you focus on real-time alerts, in-depth analysis, earnings trends, or long-term financial research.
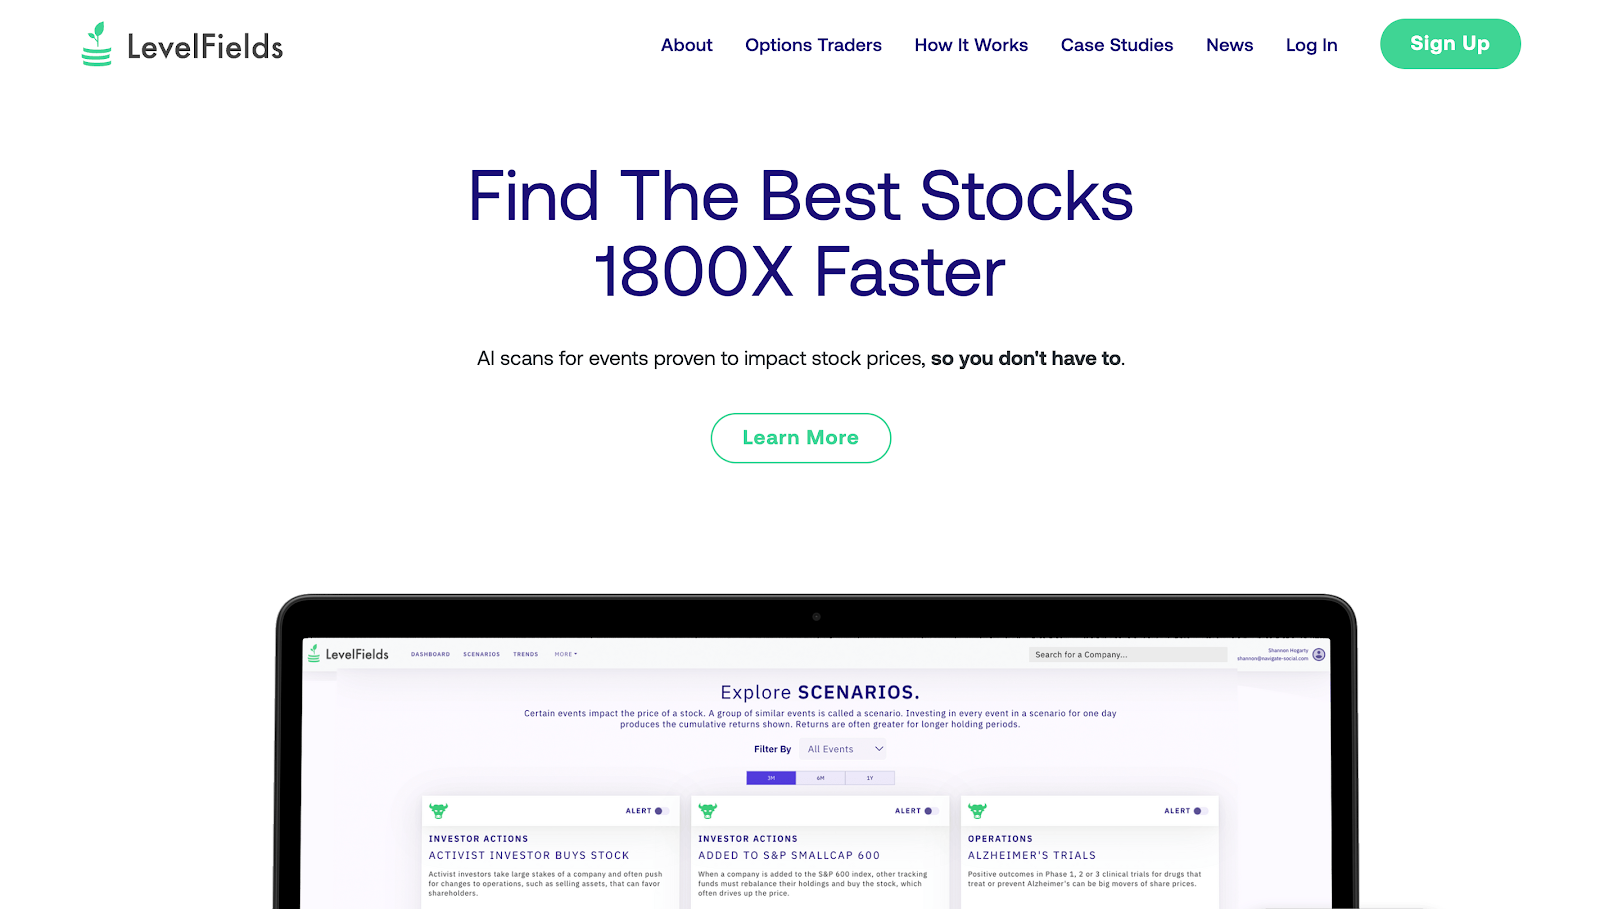
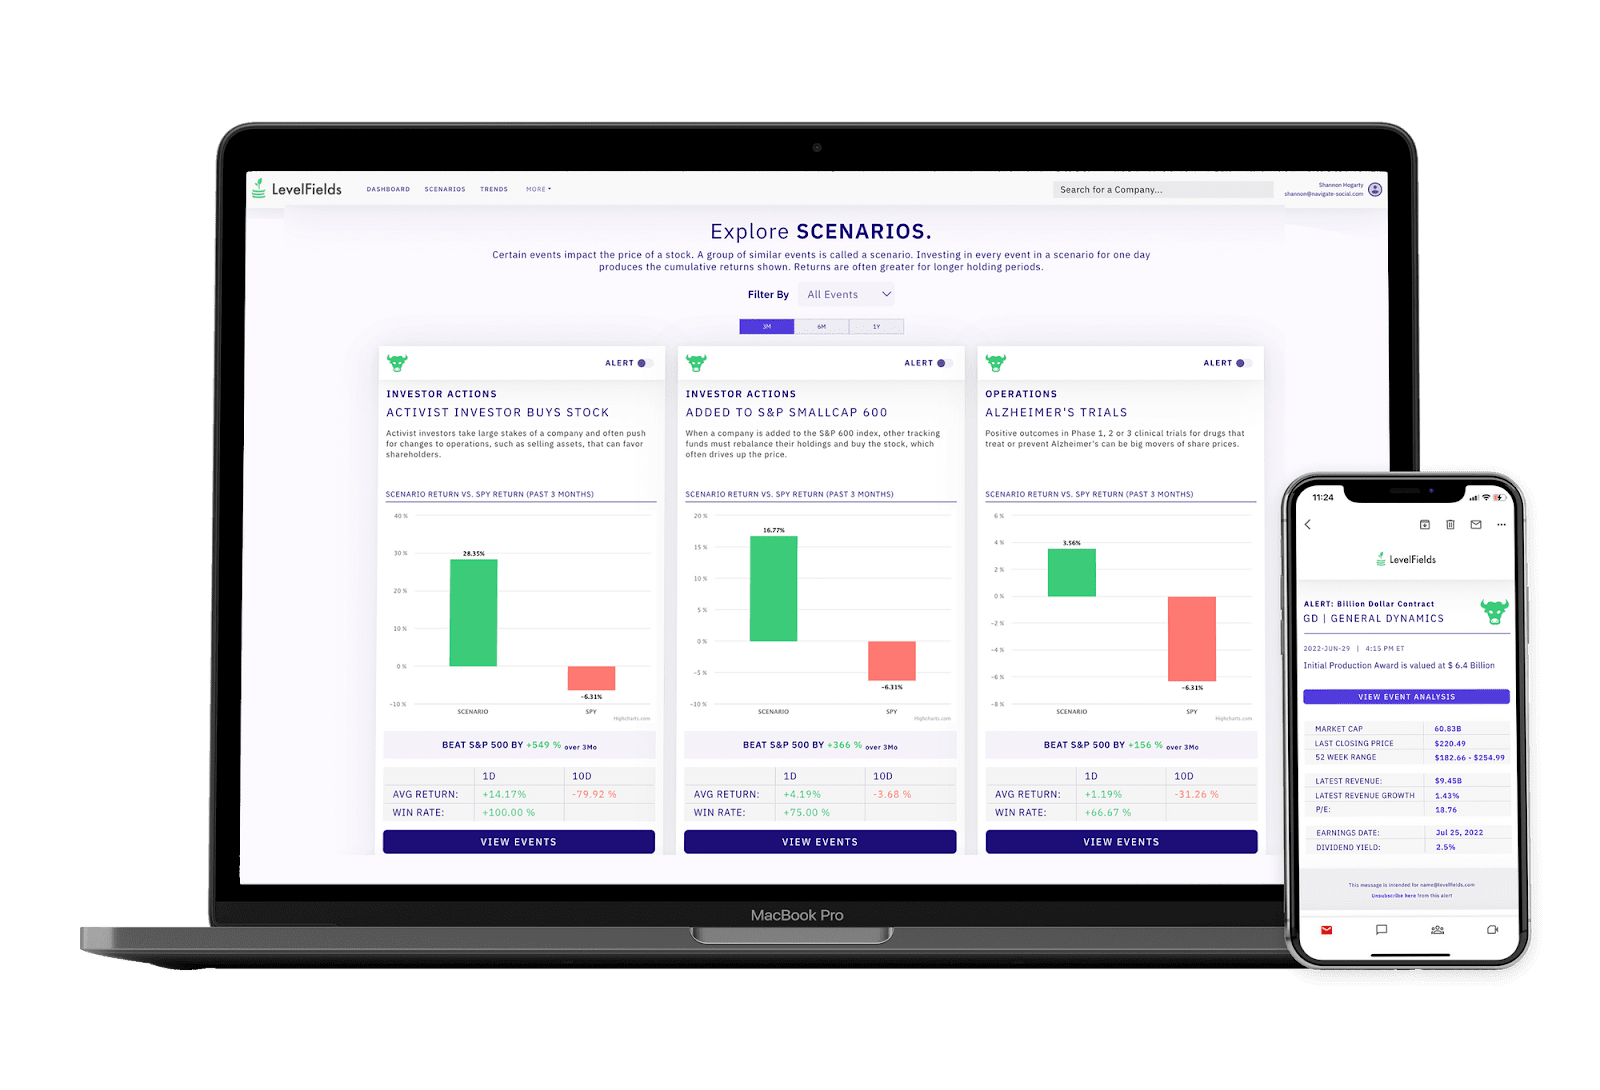
LevelFields is an AI-driven stock analysis platform that scans millions of data points. It analyzes documents, economic reports, news items, and financial filings to detect market-moving events before they impact stock prices.
Unlike traditional research tools that rely on past data and analyst opinions, LevelFields focuses on event-driven investing. This helps you react in real time to key financial developments before the crowd catches on.
With LevelFields, you can also add companies to your watchlist. Doing so allows you to monitor positions and plan for upcoming events.
You even get 24/7 alerts from your mobile devices or email accounts when new events match your investment strategy. Find the highest-probability trade ideas in seconds without manually sorting through newsfeeds.
For traders short on time or experience, LevelFields offers premium access to its AI-powered investment research tool.
You'll receive the most successful AI stock alerts, vetted by our expert team. Stay ahead of the competition and find the best investments faster.
You can also enjoy additional features, such as comprehensive news coverage, over 100 event-based alerts, unlimited custom watchlists, and five years' worth of historical data.
Plus, get an intensive 1-on-1 coaching session where our experts will walk you through the platform's investing tools. Over the past three years, these premium features from the Level 2 tier delivered an impressive 5,500% return.
Sign up now to trade stocks 1800x faster!
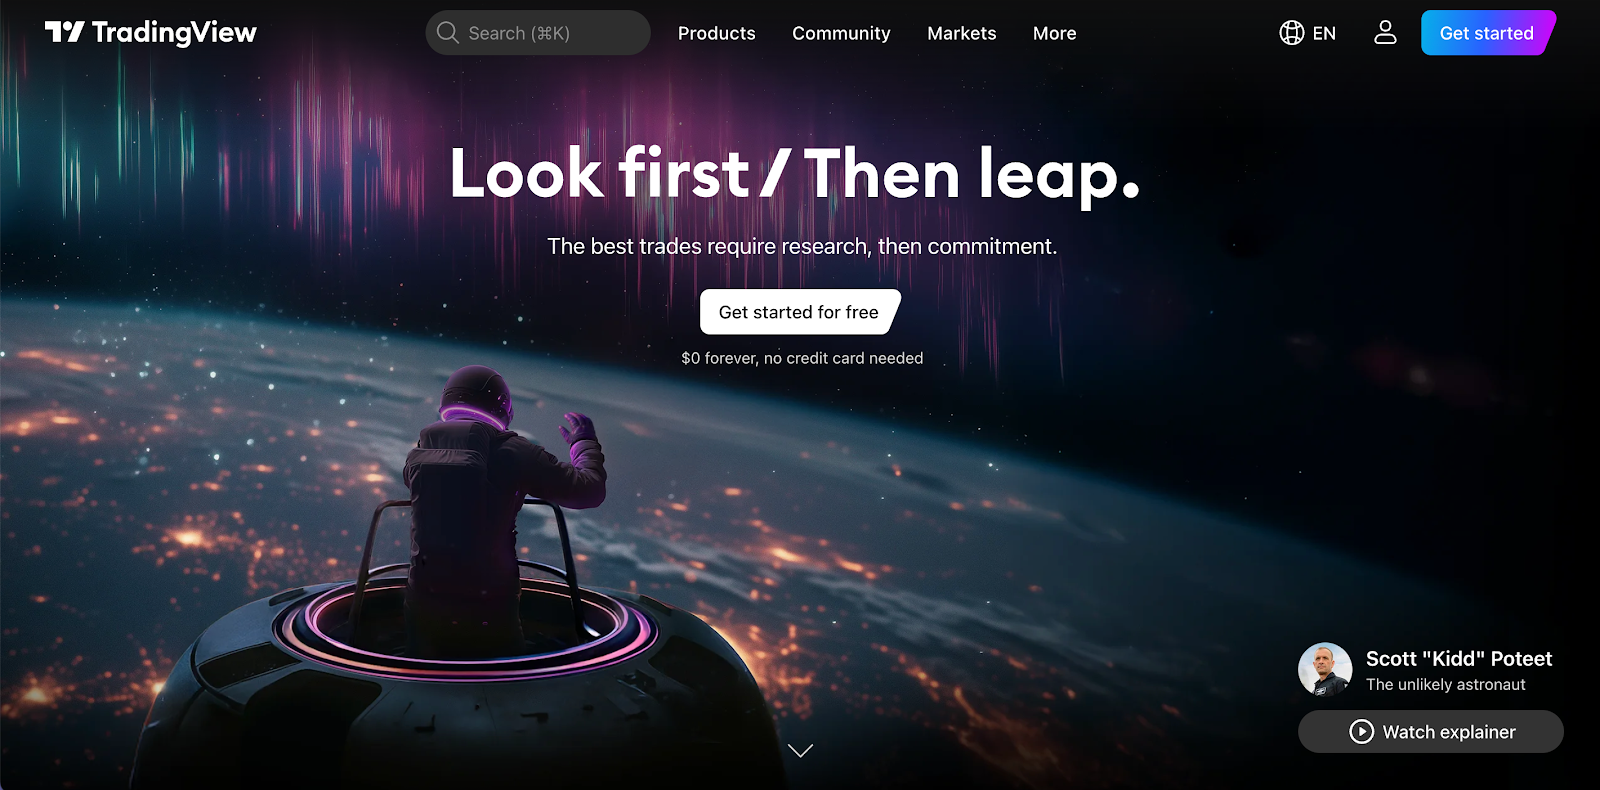
TradingView supports technical analysis and real-time market data visualization. It provides interactive stock charts, more than 400 built-in indicators, and custom scripting options that allow traders to analyze price action, identify trends, and execute complex strategies.
A key advantage of TradingView is its social trading community, where you can share ideas, publish charts, and discuss market movements with fellow investors or online brokers.
The platform also offers yearly price charts, automatic pattern recognition, and trade alerts to help you stay ahead of market movers.

Zacks Investment Research is a tool for long-term investors who focus on earnings trends and quantitative stock rankings. It is best known for the Zacks Rank system, which evaluates stocks based on earnings estimate revisions, profitability, and growth potential.
The platform also provides in-depth fundamental analysis, stock screening tools, and investment recommendations that help identify undervalued stocks and high-growth opportunities.
Zacks offers paid subscription plans, where premium members gain access to detailed analysis reports, top stock picks, and model portfolio tracking tools.
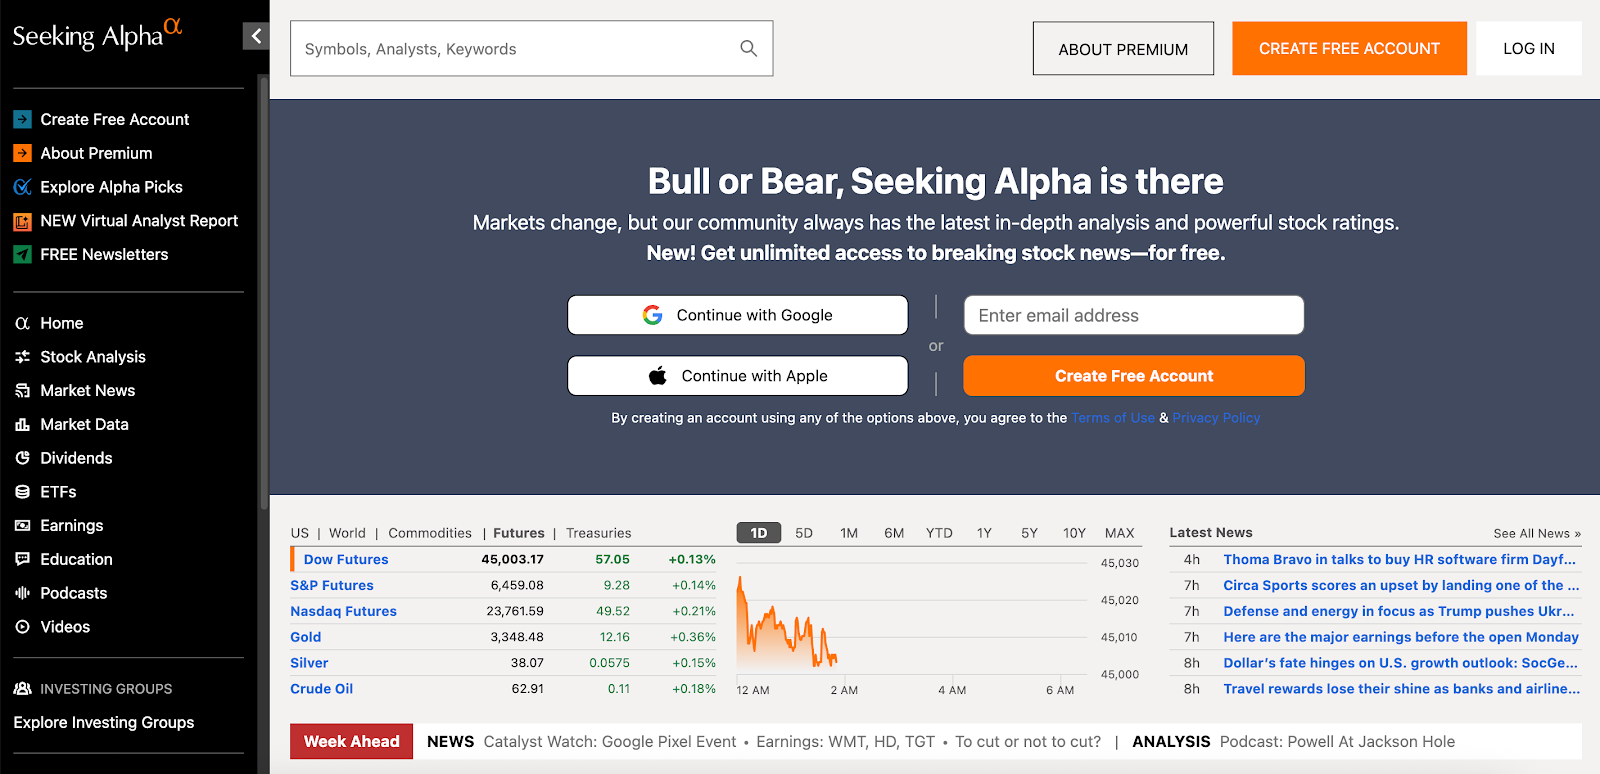
Seeking Alpha is an investment research tool that offers stock analysis, breaking market news, and community-driven insights.
The free version includes unlimited news, a single premium article, portfolio management tools, and real-time stock prices.
If you need advanced tools, Seeking Alpha also offers paid plans. These provide access to quantitative ratings, analyst recommendations, exclusive news coverage, and advanced stock screening tools.
The platform even covers stocks, ETFs, and market sectors, which are useful for active trading and long-term investments.

Stock Rover is designed for investors who rely on deep fundamental analysis and financial data. It provides extensive screening tools, portfolio tracking, and company financials for over 8,500 stocks.
The platform also includes all the tools you'll need for value investing, dividend growth, and asset allocation.
With over 700 financial metrics, earnings history, valuation ratios, and Monte Carlo simulations, Stock Rover helps you compare stocks, track long-term portfolio performance, and identify undervalued opportunities.
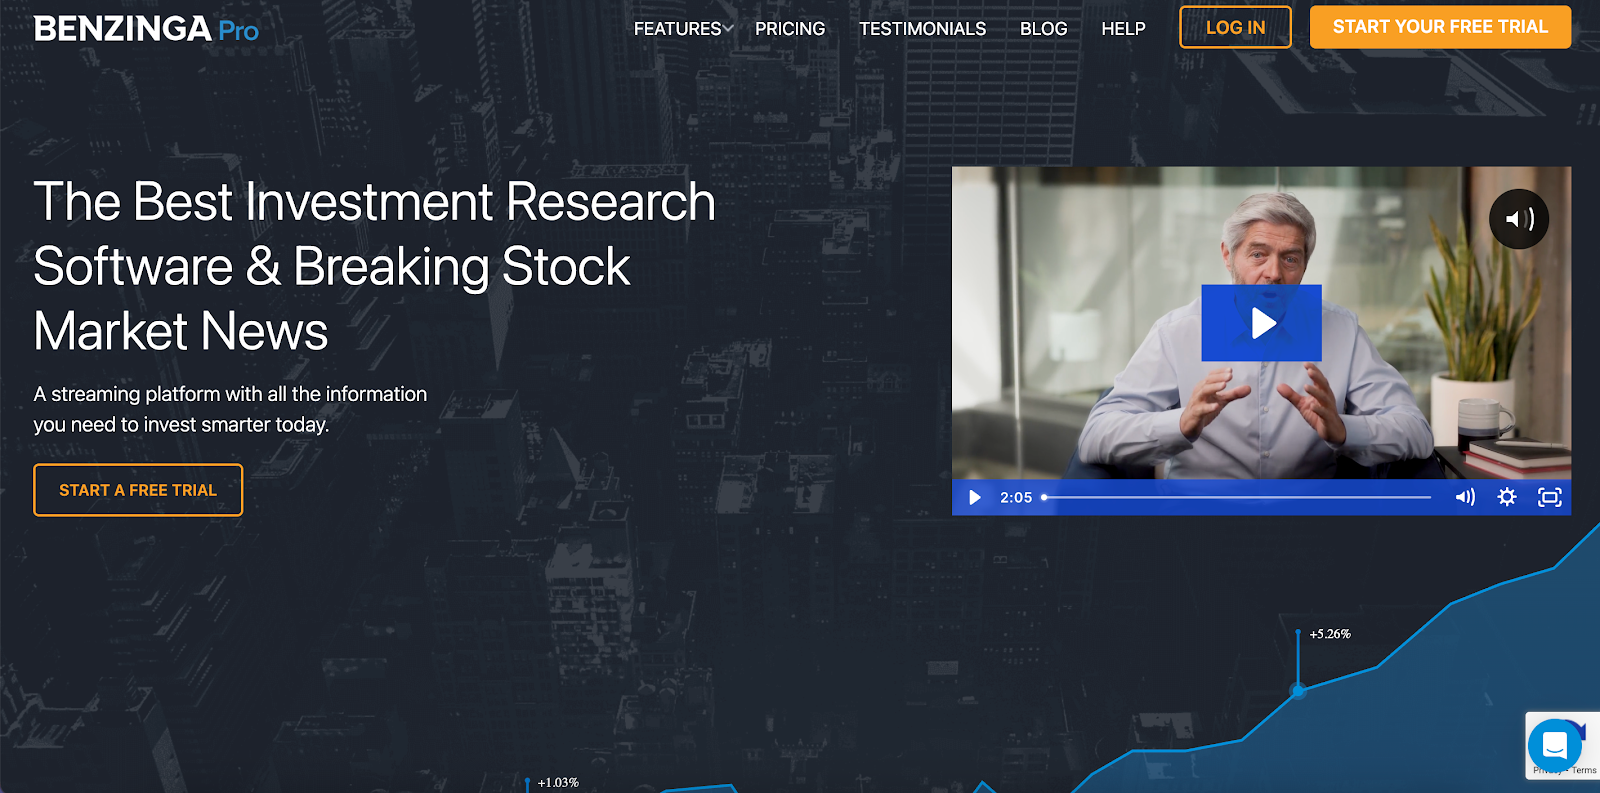
Benzinga Pro is a stock analysis platform that delivers real-time market updates, earnings announcements, and breaking financial news. It also offers actionable alerts on mobile devices to help you trade faster.
The platform provides audio squawk alerts, daily picks, and trading signals that make it easier to stay ahead of market movements.
With Benzinga Pro’s scanner and sentiment indicators, you can identify high-momentum stocks, price spikes, and unusual options activity.
Thinkorswim's advanced trading platform provides expert commentary, live-streaming news, and real-time insights into complex investment strategies.
With its thinkScript programming language, you can create and test custom trading algorithms. This helps you see how different scenarios could play out.
The platform also offers probability analysis, options backtesting, and futures trading capabilities. These allow you to put your concepts to the test before applying them in real-world conditions.
Whether you're a self-directed investor or a professional trader, you need more than just a hunch to make the right moves. The market changes quickly, and without the right tools, it’s easy to miss opportunities or make costly mistakes.
Here are the top reasons why stock analysis apps matter:
Scanning thousands of stocks manually isn’t realistic, especially when prices shift every second.
That is where stock screeners come in. These tools let you filter stocks based on what matters most to you. You can look for:
A good stock market analysis tool will help you sort through the noise and focus on stocks that fit your goals.
Without this, you’re left chasing stocks based on headlines or social media buzz, which can lead to bad trades.
Trading is not just about making money, but also protecting what you have.
A good stock market analysis tool helps you track a stock’s past performance. It shows how volatile a stock has been and how it reacts to different market conditions.
Some tools allow you to set stop-loss orders, which automatically sell a stock when it drops to a certain price. This prevents you from holding onto a losing stock for too long, hoping it will recover.
Studying price movements, market trends, and past performance helps you protect your investments. No one wins every trade, but managing risk wisely can help you stay in the game for the long run.
Stock prices don’t wait for anyone. If you’re trading based on old data, you’re already behind.
Real-time data helps you react as things happen. When a stock’s price starts moving, you need to know immediately and not minutes later, when it’s too late to act.
Fortunately, many free stock analysis tools provide live updates on:
This gives you the chance to set alerts for stocks you’re watching so you don’t have to stare at a screen all day. If a stock hits your target price or a major event affects a company, you’ll know right away.
This tool can save you from missing the best entry and exit points. Even long-term investors can benefit from real-time alerts, especially when tracking major events like earnings reports or economic announcements.
No trader wants to lose money testing a strategy that doesn’t work. This is where backtesting tools come in.
Instead of guessing whether a strategy will work, you can run it through past market data to see how it would have performed.
For example, if you think a stock will rise when its 50-day moving average crosses above the 200-day moving average, you can test that idea using historical data. You can trade with more confidence when the results show that this strategy has worked well in the past.
Many professional traders rely on backtesting tools to improve their investment portfolios. Without this feature, every new strategy would be a gamble, and it would expose you to unnecessary losses.
Stock prices don’t move based on numbers alone. News, earnings reports, and even social media trends can cause stocks to rise or fall quickly.
If you’re not staying on top of financial news, you could be caught off guard by sudden price changes.
Many stock market analysis tools can get stock news in real time by scanning:
Some even use sentiment analysis to measure investor mood and see whether a stock is gaining or losing interest among traders.
Tracking both data and news will allow you to make better-informed decisions.
Not every trader follows the same strategy, but regardless of how you invest, having the right stock market analysis tool makes a difference.
No matter how you approach the market, you need tools that fit your investment style. Choosing the right platform helps you trade with more confidence.
Looking to improve your investment strategy? LevelFields gives you access to advanced analytics that help you identify opportunities 1,800 times faster.
It analyzes over 1.8 million market events each month to deliver data-backed insights so you can make informed decisions instead of relying on speculation. Trading should be based on facts, not guesswork.
Sign up today and start turning market insights into profits!
The best stock market analysis tool depends on your needs and investment style.
Some traders prefer platforms where technical analysis focuses on price charts and patterns. However, others need fundamental analysis tools that provide income statements, balance sheets, and cash flow statements.
For those tracking market trends and news, consider using AI-powered platforms like LevelFields. These tools scan news headlines, earnings reports, regulatory actions, and other events to surface the highest-probability trade ideas in seconds.
The 3‑5‑7 rule is a risk management strategy that helps traders limit exposure and protect capital. It suggests risking no more than 3% on any single trade, keeping exposure across open positions under 5%, and maintaining overall market exposure at no more than 7% of your portfolio.
ChatGPT can explain concepts, summarize news, or answer general investing questions. However, it does not provide real-time market data, financial advice, or personalized trading signals.
To act on insights, investors still need a brokerage account and a dedicated analysis tool that tracks price movements, earnings, and market events in real time.
The 10 am rule suggests waiting until after 10 am before making trades. The first 30 minutes of the market are often volatile, driven by overnight news, pre-market activity, and early reactions from traders.
When you wait, you can avoid unpredictable swings and observe more reliable price trends. Consider using free stock research tools to help identify these patterns and guide smarter trading decisions once the market settles.
Join LevelFields now to be the first to know about events that affect stock prices and uncover unique investment opportunities. Choose from events, view price reactions, and set event alerts with our AI-powered platform. Don't miss out on daily opportunities from 6,300 companies monitored 24/7. Act on facts, not opinions, and let LevelFields help you become a better investor.

AI scans for events proven to impact stock prices, so you don't have to.
LEARN MORE