
Explore the main types of stock analysis and learn how you can use them. Discover how LevelFields can help you analyze stocks and make the best call.
Trading Strategies
July 30, 2025


Table of Contents
If you’re trying to figure out whether a stock is worth buying, you need more than a gut feeling. You need a way to break it down.
That’s where understanding the different types of stock analysis comes in. Each method provides a unique perspective on how a company is performing and where its stock price might be headed.
You might prefer digging into earnings reports and balance sheets. Or maybe you lean on price movements, market trends, and trading patterns. Either way, tools like AI stock analysis software now make it easier to uncover insights quickly, helping you cut through the noise and focus on what actually matters.
In this guide, we’ll walk through the most common ways to analyze stocks, what each one tells you, and how to use them to make smarter, more confident moves in the stock market.
At its core, stock analysis is the process of evaluating a company and its shares to decide whether it’s a smart investment. You’re not just looking at the current stock price. You’re also examining all the data that might explain where that stock is headed next.
This includes everything from the company’s financial statements (like the income statement and balance sheet) to broader market trends, stock price movements, and industry news. Some investors focus on numbers; others watch behavior, patterns, and market sentiment.
If you’re trying to make informed investment decisions, stock analysis is your starting point. It helps you:
Whether you’re investing for the long haul or trading based on short-term price movements, knowing how to analyze a stock helps you avoid hype and find real value.
There are several different types of stock analysis, and the one you choose depends on your style, goals, and tolerance for risk.
Before you invest in any stock, it’s important to know how to evaluate it, and there’s no single right way to do that. Different types of stock analysis give you different insights, whether you’re focused on a company’s financial foundation, short-term price action, or long-term market trends.
Here are five trusted techniques.
Fundamental analysis focuses on a company’s core business and financial health. It aims to determine a stock’s intrinsic value, or what it should be worth, by studying the company’s financial statements, operations, industry position, and overall outlook.
This approach is less about short-term price movements and more about long-term performance.
To assess a company, fundamental analysts dig into:
These insights help determine whether a company is undervalued or overpriced based on actual performance, not speculation.
Use fundamental analysis when you’re:
If you want to invest with confidence and avoid overpaying, fundamental analysis gives you a grounded perspective. It lets you focus on companies with real value and long-term growth potential.
It’s especially useful for spotting quality stocks that have taken a hit during down markets, but still have strong fundamentals.
Technical analysis focuses on a stock’s price movements, trading history, and volume to predict future price movements. Instead of digging into the company’s fundamentals, this method relies on charts, patterns, and technical indicators.
In short, technical analysts believe that everything you need to know about a stock, such as demand, investor sentiment, and momentum, is already reflected in its price.
Technical analysts study:
Rather than ask "Is this company profitable?", technical analysis asks "How are traders behaving right now?"
Use technical analysis when you’re:
If you’re trying to identify patterns, anticipate short-term moves, or catch a breakout, technical analysis gives you real-time signals. It’s beneficial in volatile market conditions or when a stock is heavily influenced by news, trading volume, or speculation.
This technique also helps you manage risk with more precise entries and exits.
Quantitative analysis uses mathematical models and statistical data to evaluate investments. Instead of just looking at one company, this method often compares dozens, or even hundreds, of stocks using formulas and algorithms.
The goal? Spot opportunities, remove emotion, and make data-driven investment decisions based on measurable performance metrics.
Quantitative analysts rely on:
Some quants also factor in macroeconomic indicators, like inflation or GDP, to fine-tune their models for real-world conditions.
Use quantitative analysis when you’re:
Quantitative analysis removes bias and guesswork. By relying on proven data and formulas, you can remain consistent and objective, even during periods of market uncertainty.
It also uncovers opportunities that might not be obvious at first glance, especially when used at scale.
Sentiment analysis gauges how people feel about a stock or the broader stock market. It pulls from sources like news headlines, earnings calls, social media, and financial forums to understand the mood (bullish or bearish) behind price movements.
Rather than focusing on financial data alone, this method taps into market psychology and crowd behavior.
Sentiment analysis tools may scan:
Modern platforms often pair sentiment signals with AI stock analysis software to process huge volumes of text and detect changes in tone or keywords in real time.
Use sentiment analysis when you’re:
Markets aren’t always rational, and emotion drives a lot of short-term moves. A single post or rumor can trigger price movements, especially for smaller-cap or speculative stocks.
By identifying mood swings early, investors can ride the wave or get out before the crowd turns.
Event-driven analysis focuses on how specific corporate or economic events impact a stock's current price. This trading style is rooted in the idea that certain events, such as leadership changes, product launches, or government actions, can trigger price movements.
Instead of basing decisions solely on long-term financial data or chart patterns, event-driven investing looks for catalysts that can quickly change market sentiment or valuation.
Event-driven analysts monitor and evaluate:
You can use event-driven strategies if you want to:
Trade markets often react quickly, and sometimes irrationally, to new information. Event-driven analysis helps you stay ahead of those reactions by focusing on what just happened and what it means.
By using this approach, you can position yourself before the crowd, manage risk proactively, and spot opportunities others might miss.
Consider using tools like LevelFields to scan thousands of news sources and financial filings in real time. This way, you can act on events as they unfold, and not hours or days later.
Uncover unique trading opportunities based on live events. Start using LevelFields today!
Not all investors look at the stock market the same way, and that’s okay. The best stock market analysis method depends on your goals, timeline, and how comfortable you are with risk and research.
Below, we’ll help you match your approach with the right type of analysis so you can make more informed investment decisions.
Are you investing for the long haul or trading short-term momentum?
If you’re looking for steady growth over time, fundamental analysis gives you insight into a company’s financial health, profit margins, and long-term intrinsic value.
If you're reacting to market news or seeking faster trades, technical analysis focuses on chart patterns, historical price movements, and price action trends to spot entry and exit points.
Your risk tolerance also plays a key role. Fundamental analysis may offer more stability, while technical approaches often appeal to those comfortable with volatility.
Short-term traders often rely on technical analysis to study stock charts, volume, and market conditions, as well as sentiment analysis tools to gauge momentum based on news, social media, or crowd behavior.
Long-term investors, on the other hand, tend to focus on fundamental analysis, diving into financial statements, balance sheets, and earnings to evaluate a fair price. They also incorporate industry trends, a company's management team, and sustainable competitive advantage into their analysis.
Do you prefer numbers or narratives?
If you're data-driven and love financial ratios, fundamental analysis examines everything from cash flow to management quality. It’s ideal for those who want to understand how a company’s financial performance stacks up over time.
If you’re more visually inclined or prefer spotting trends, technical analysis uses charts and indicators to predict future price movements based on historical data.
Event-driven analysis suits investors who prefer tracking real-time news, corporate actions, and market catalysts over combing through financial statements or charts. It appeals to those who thrive on fast-paced decision-making and staying ahead of headlines.
Before committing to a specific stock analysis technique, think about:
Whichever path you choose, understanding the core differences between these types of analysis helps you stay grounded in strategy rather than speculation, and gives you an edge in any market conditions.
Understanding the different types of stock analysis is the first step. Putting them into action is where things get real.
That’s where LevelFields comes in.
LevelFields simplifies the research process with real-time alerts powered by structured historical data and predictive algorithms.
Whether you're tracking market trends, looking for intrinsic value, or reacting to news that could impact stock prices, LevelFields has got you covered.
LevelFields empowers you to spot a company's stock movements earlier, filter noise from the financial markets, and act on opportunities with more confidence.
From monitoring management quality to scanning the stock market for price triggers, it's your one-stop platform for smarter, more strategic investing.
Ready to trade with confidence? Join LevelFields now and turn analysis into action.
The three main types of stock analysis are:
Each approach offers unique insights and is often used together in a fundamental and technical combo.
The 7% rule is a risk-management strategy often used by technical analysts and traders. It suggests that if a company's stock falls 7% below your purchase price, it’s time to sell and protect your capital. While not foolproof, it can help limit losses, especially during high-volatility periods in the stock market.
There’s no one-size-fits-all answer. Fundamental analysis is best for long-term investors looking for intrinsic value and management quality, while technical analysis is ideal for short-term traders who follow market trends and momentum.
Combining fundamental and technical analysis allows for a more complete view of a stock’s potential.
When people talk about the types of stock markets, they typically refer to:
Each market operates under different rules and plays a unique role in shaping financial markets.
Join LevelFields now to be the first to know about events that affect stock prices and uncover unique investment opportunities. Choose from events, view price reactions, and set event alerts with our AI-powered platform. Don't miss out on daily opportunities from 6,300 companies monitored 24/7. Act on facts, not opinions, and let LevelFields help you become a better investor.

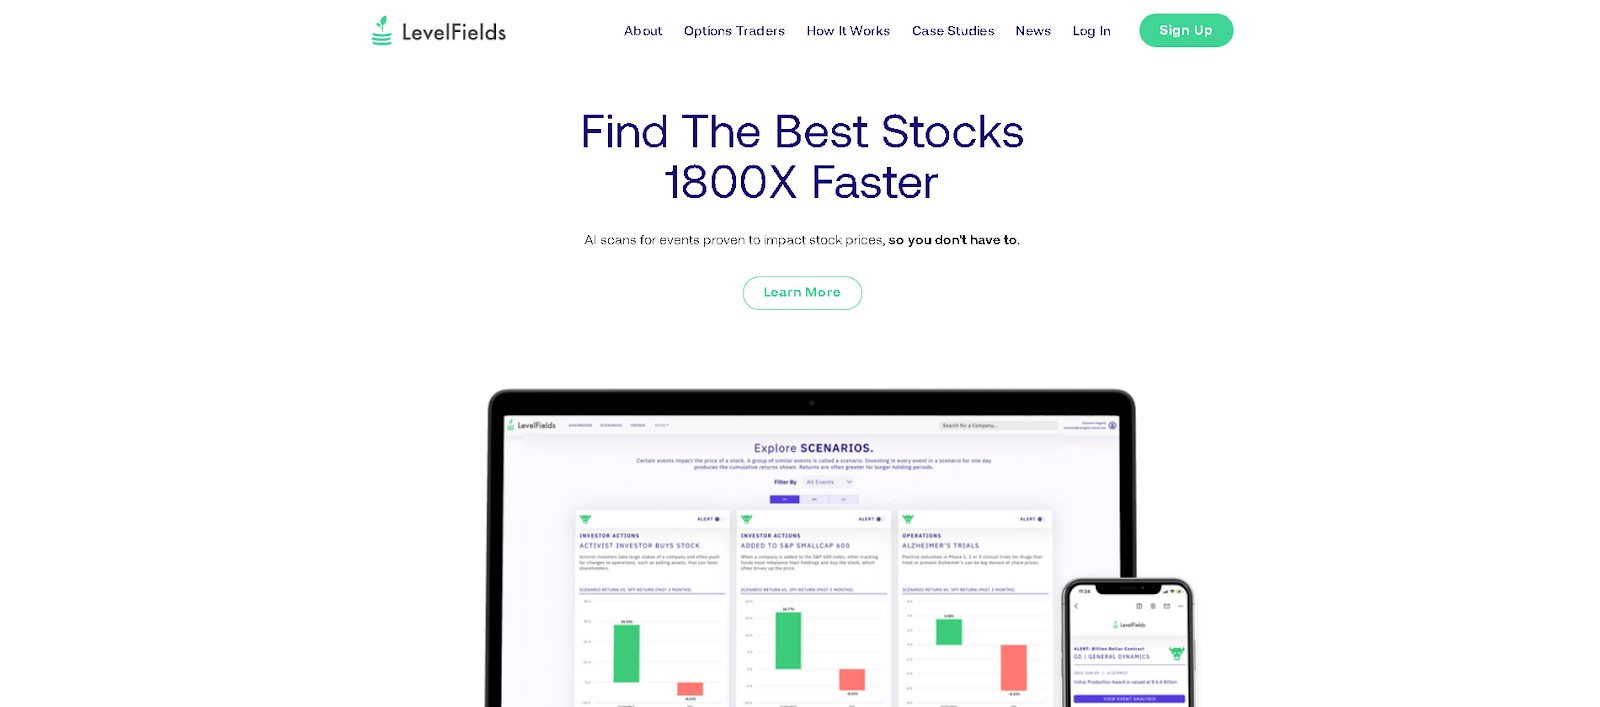
AI scans for events proven to impact stock prices, so you don't have to.
LEARN MORE