
Cup and handle pattern explained including structure, breakout rules, success rate, and how traders identify bullish continuation signals
Sectors & Industries
March 13, 2026


Table of Contents
The cup-and-handle pattern is one of the most widely recognized bullish continuation patterns in technical analysis. First popularized by William J. O’Neil, the formation represents a period of consolidation followed by renewed upward momentum. It reflects accumulation, temporary exhaustion, and eventual breakout as buyers regain control.
When properly formed, the pattern signals that a stock, index, or asset may continue its prior uptrend after completing a consolidation phase.
This guide explains the structure, variations, statistical reliability, trading rules, real-world performance, and how traders identify and use the cup-and-handle pattern.
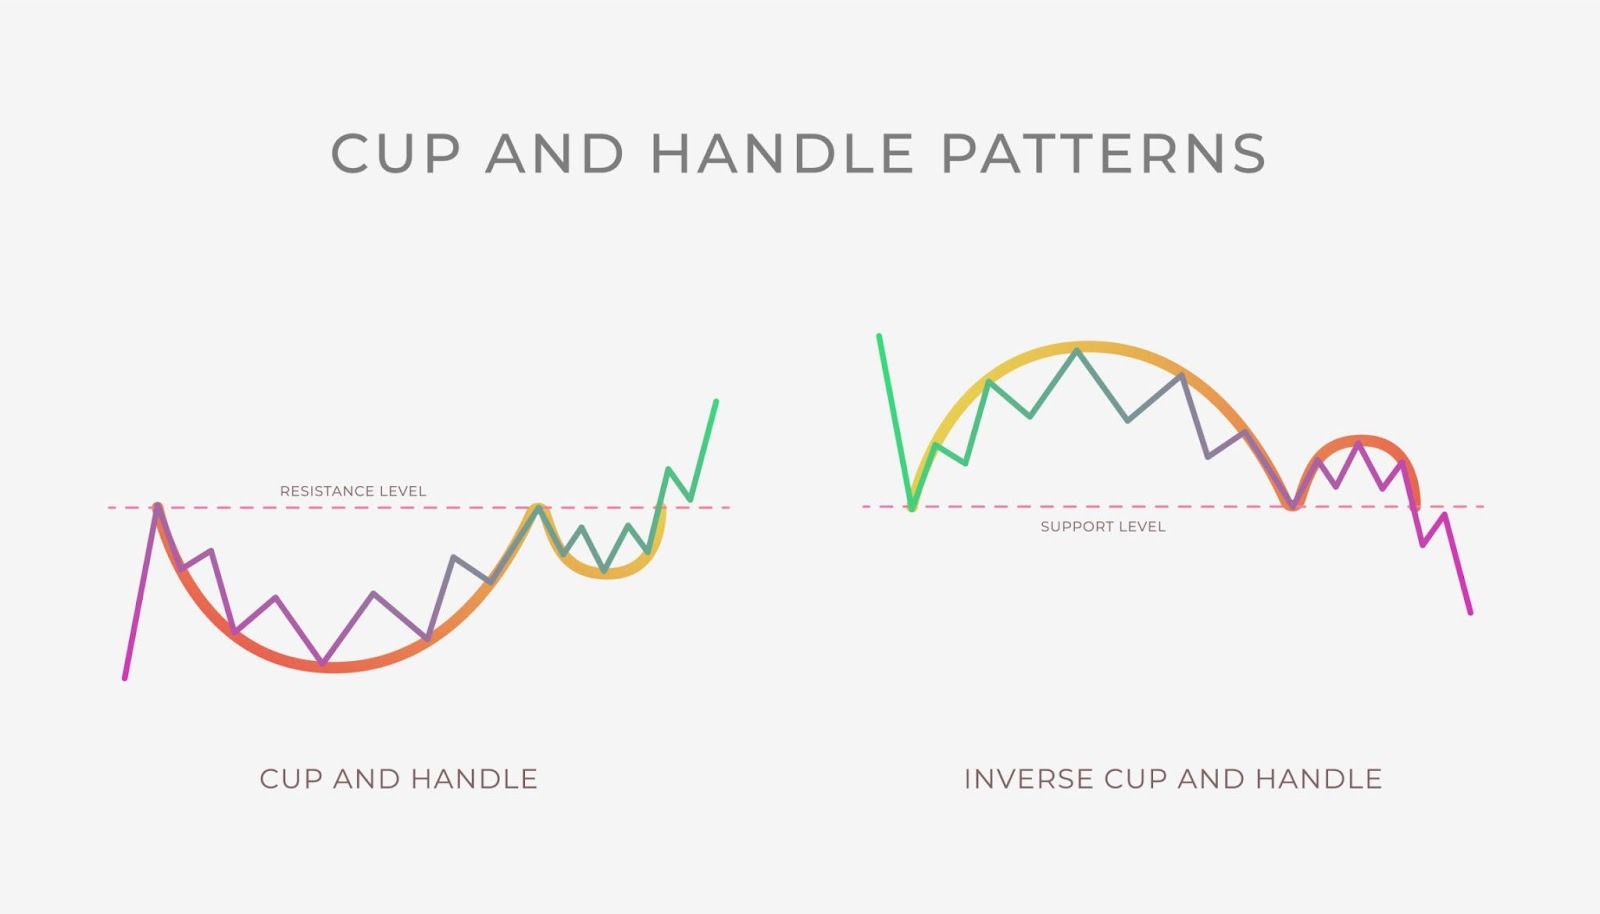
The cup-and-handle pattern resembles a teacup when viewed on a price chart.
It consists of two main parts:
1. The Cup:
A rounded “U-shaped” consolidation where price declines, stabilizes, and gradually recovers to its prior high.
2. The Handle:
A smaller pullback or sideways consolidation near the prior high, forming just before the breakout.
The pattern completes when price breaks above the resistance level formed by the cup’s rim.
This breakout signals renewed bullish momentum and often leads to further price appreciation.
The cup-and-handle pattern reflects the psychology of market participants.
It typically develops in five phases:
This structure reflects a transition from selling pressure to renewed accumulation.
The strongest cup and handle patterns do not form randomly. They usually form when something important is changing within the company. This could include earnings growth, new contracts, analyst upgrades, or improving financial performance.
These events create sustained buying pressure over time. This steady accumulation is what forms the rounded cup. The handle forms as short-term traders exit, and the breakout happens when long-term buyers continue accumulating shares.
This is where combining technical patterns with event awareness becomes powerful.
Instead of only watching charts, investors can track whether real catalysts exist behind the pattern. Platforms like LevelFields AI help surface companies experiencing meaningful events such as buybacks, dividend increases, major contracts, or leadership changes. These events often create the exact type of institutional accumulation that leads to continuation patterns like the cup and handle.
This does not replace technical analysis. It strengthens it by helping investors focus on stocks where demand has a clear underlying driver, not just a chart formation.
The most common entry point is slightly above the handle resistance. This confirms that buyers are in control and momentum is building.
More conservative traders wait for a full daily close above resistance before entering. This reduces false breakouts but may result in a slightly higher entry price.
The stop loss is typically placed just below the lowest point of the handle. If the price falls below this level, the pattern has failed and risk should be limited.
Profit targets are usually based on the depth of the cup. For example, if the cup is $10 deep, traders project a $10 move above the breakout point. This creates favorable risk-reward setups, often risking $5 to potentially gain $10 or more.
Cup and handle patterns are more reliable on longer timeframes. Daily and weekly charts produce stronger signals than intraday charts because they reflect institutional activity rather than short-term noise.
Patterns forming over several months tend to produce larger and more sustained breakouts. Short patterns forming over a few days often lack meaningful accumulation.
This is why patient traders often achieve better results. The longer the accumulation phase, the stronger the breakout potential.
One common mistake is entering before the breakout. Many traders anticipate the move and enter too early, increasing the risk of failure.
Another mistake is ignoring volume. Breakouts without strong volume often fail because there is not enough buying pressure to sustain the move.
Traders also misidentify patterns that are too deep or too sharp. Proper cup and handle patterns form gradually, not abruptly.
Finally, poor risk management leads to losses. Even strong patterns can fail. Proper stop loss placement protects capital and allows traders to stay consistent long term.
The cup and handle pattern is most effective when used alongside broader analysis. Fundamentals help identify strong companies. Technical patterns help with timing. Event awareness helps explain why momentum is building.
When these factors align, continuation patterns like the cup and handle become significantly more reliable.
Over time, investors who combine structure, discipline, and awareness of real market drivers are better positioned to identify high-probability breakouts and manage risk effectively.
The cup-and-handle pattern remains one of the most important bullish continuation formations in technical analysis.
When properly formed and confirmed with volume and trend alignment, it offers:
However, it requires disciplined execution, confirmation, and risk management.
Traders who combine structural pattern recognition with proper risk control can use the cup-and-handle pattern to identify high-probability breakout opportunities across stocks, indices, forex, and other markets.
Yes, the cup and handle is widely considered a bullish continuation pattern in technical analysis. It typically forms after an uptrend and signals that the stock may continue moving higher once the pattern completes.
The pattern resembles a rounded "cup" followed by a smaller pullback called the "handle." This structure reflects a period of consolidation where sellers exit and buyers gradually regain control. When the stock breaks above the resistance level formed at the top of the cup, it often confirms bullish momentum.
Swing traders and technical analysts use the cup and handle pattern to identify potential breakout opportunities, especially in strong trending stocks.
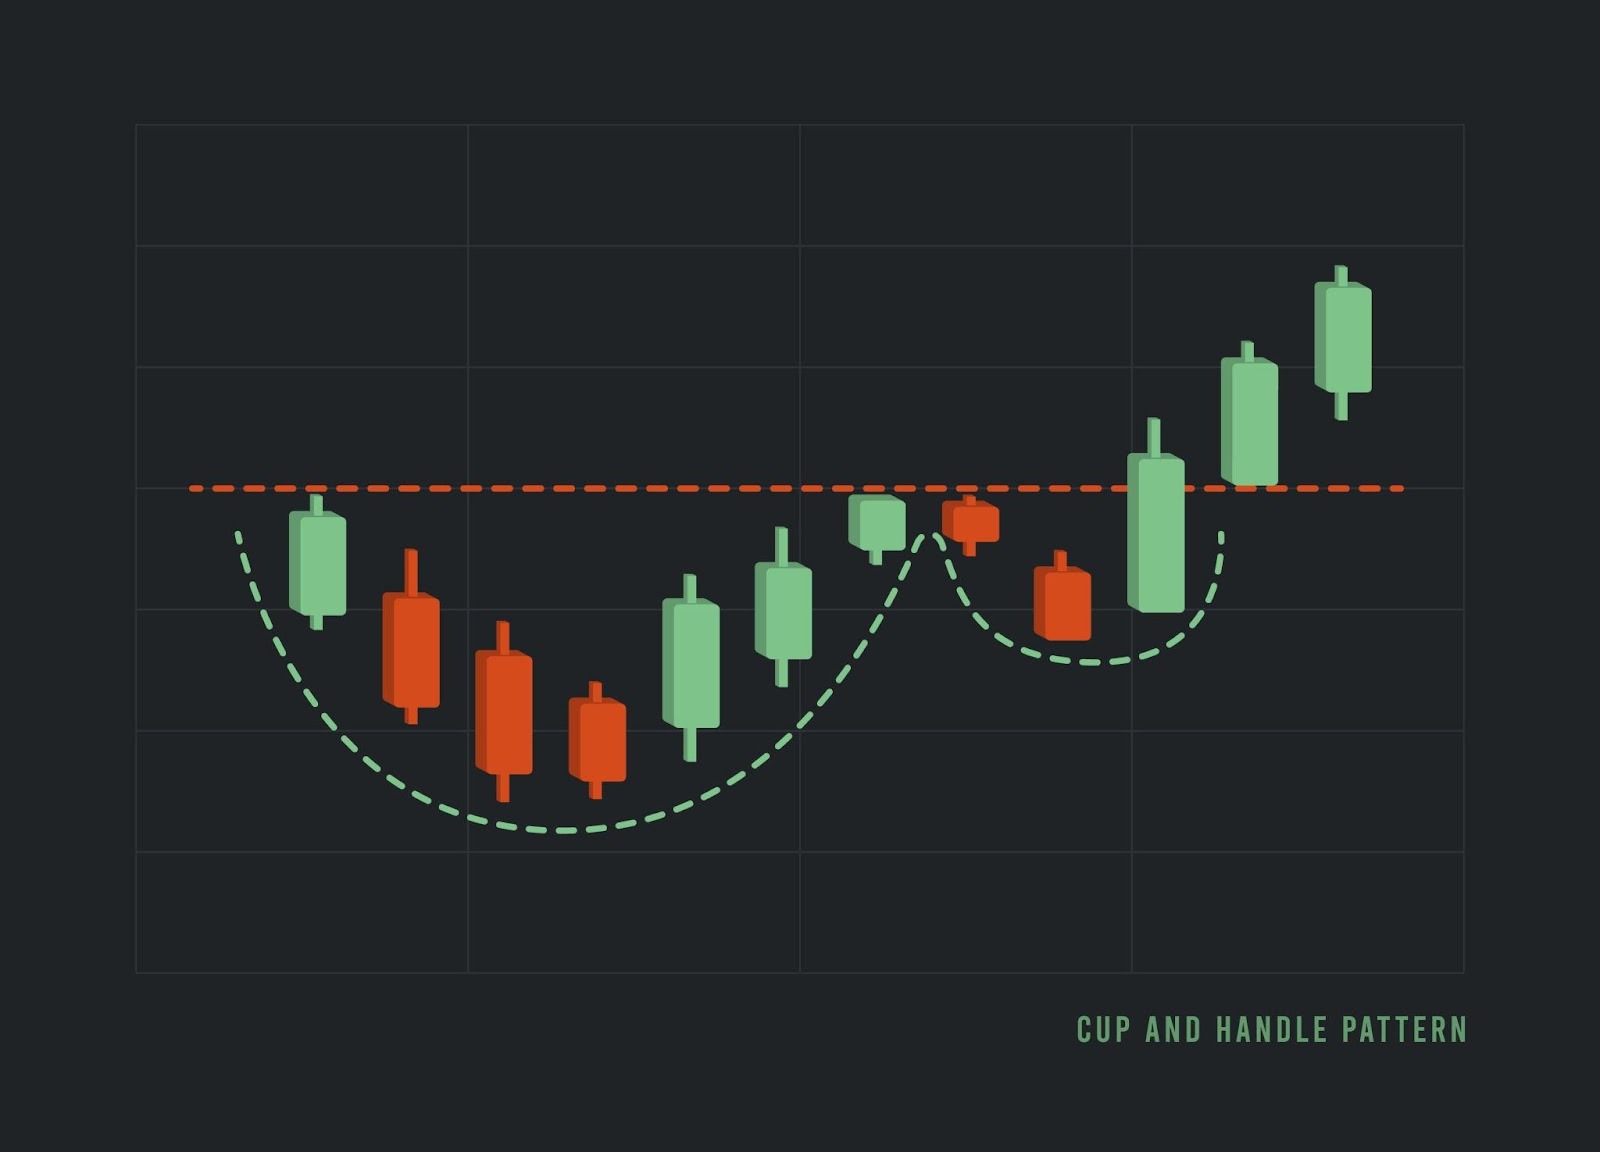
A valid cup and handle pattern follows several key technical rules.
The cup should form a smooth, rounded bottom rather than a sharp V shape. This indicates gradual accumulation rather than short term volatility. The handle should form as a smaller pullback near the prior high, usually declining slightly on lower volume.
Other important rules include:
These characteristics help confirm the pattern’s reliability.
The 90 percent rule in trading often refers to the idea that most traders lose money because they lack discipline and risk management. While definitions vary, it highlights the importance of capital preservation and consistent strategy.
Successful traders focus on:
Risk management matters more than finding perfect chart patterns.
The cup and handle pattern has historically shown a relatively high success rate when properly formed, especially in strong market conditions.
Studies of technical chart patterns suggest that cup and handle breakouts can succeed more than half the time, particularly when supported by volume and broader market strength. The success rate improves when the pattern forms over longer timeframes and aligns with the overall trend.
However, no pattern guarantees results. Confirmation and risk management remain essential.
The cup and handle pattern works best on daily and weekly charts, where the structure develops over weeks or months.
Longer timeframes tend to produce more reliable signals because they reflect sustained buying and selling behavior. Short timeframes, such as minute charts, often produce false signals due to noise and volatility.
Swing traders commonly use daily charts to identify cup and handle patterns and weekly charts to confirm long term trend strength.
There is no single strongest bullish pattern, but several patterns are widely respected for their reliability.
Common strong bullish patterns include:
The strongest patterns usually form during confirmed uptrends and are supported by increasing volume. The context of the broader market and underlying catalyst often matters as much as the pattern itself.
Join LevelFields now to be the first to know about events that affect stock prices and uncover unique investment opportunities. Choose from events, view price reactions, and set event alerts with our AI-powered platform. Don't miss out on daily opportunities from 6,300 companies monitored 24/7. Act on facts, not opinions, and let LevelFields help you become a better investor.

AI scans for events proven to impact stock prices, so you don't have to.
LEARN MORE