.png)

L2 Weekly Stock Market News Analysis
March 15th, 2026

TLDR:
Markets head into mid-March with three major forces now colliding at once: the widening Middle East energy shock, growing stress in private credit, and a Federal Reserve meeting that could reshape expectations for the next phase of monetary policy.
The biggest driver remains the war in the Middle East and its impact on global energy flows. The U.S. strike on Kharg Island over the weekend raised the stakes by targeting the key hub for Iran’s oil exports, while shipping through the Strait of Hormuz remains heavily disrupted. That matters because Hormuz is not just an oil story anymore — the shock is now spreading into fertilizer, aluminum, freight, and broader supply chains. Markets are also watching signs that Iran may allow limited passage for certain vessels, potentially tied to non-dollar trade, adding a financial dimension to an already volatile energy crisis.
At the same time, investors are turning their attention to the Federal Reserve and a crowded week of central bank decisions around the world. The Fed is widely expected to leave rates unchanged at 3.50%–3.75%, but markets will be focused on Chair Powell’s guidance on inflation risks tied to higher energy prices and whether policymakers still see room to ease later this year. February PPI, industrial production, housing data, and regional manufacturing surveys will offer a fresh read on inflation and growth, while China’s industrial production, retail sales, and fixed-asset investment data will help shape the global macro outlook.
Sector performance last week showed broad weakness beneath the surface. Energy (XLE) was the only sector to finish higher, rising +1.82%, as investors leaned into oil exposure tied to geopolitical risk. Losses were widespread elsewhere, with Utilities (XLU) down –0.85%, Consumer Staples (XLP) down –1.36%, and Technology (XLK) down –1.67%. The sharpest declines came from Industrials (XLI) down –3.96%, Consumer Discretionary (XLY) down –4.32%, and Financials (XLF) down –4.68%, suggesting investors were pulling back from cyclical and credit-sensitive parts of the market.
The Strategic Playbook We Outlined Last Week
Last week’s newsletter argued that several geopolitical events unfolding at once were not random crises, but part of a broader strategic sequence shaping global energy flows and economic leverage.
The core theme was simple: U.S. policy increasingly appears focused on securing energy supply chains, strengthening access to critical resources, and protecting the dollar’s role in global trade.
When viewed together, developments that are often discussed separately — pressure on Venezuela, tighter North American energy alignment, growing focus on Greenland’s resources, confrontation with Iran, and Russia’s role in global oil markets — begin to look like different pieces of the same strategic puzzle.
Step 1: Venezuela — Disrupt Discounted Energy Flows
Venezuela holds the world’s largest proven oil reserves along with major deposits of lithium, gold, and rare earth minerals.
For years, China has relied heavily on discounted Venezuelan crude, importing hundreds of thousands of barrels per day through shadow shipping networks designed to bypass Western sanctions.
Pressure on Venezuela therefore does more than reshape the country’s political leadership. It weakens one of China’s alternative energy supply channels outside Western financial systems.
Step 2: Canada — Consolidate a North American Energy Block
While Venezuela represents pressure abroad, Canada represents consolidation at home.
Canada possesses the world’s third-largest oil reserves along with vast mineral deposits and expanding Arctic shipping routes.
Closer economic and energy alignment between the United States and Canada effectively creates a continental energy and resource bloc combining:
- Canadian oil and minerals
- U.S. capital markets
- North American manufacturing capacity
That integrated base gives the West a strategic resource advantage few competitors can replicate.
Step 3: Greenland — Secure Future Critical Minerals
Greenland’s role in the sequence is about strategic geography and future resource control.
The island contains major deposits of rare earth elements, uranium, graphite, titanium, and other minerals critical for defense systems, energy infrastructure, and advanced manufacturing.
As Arctic shipping routes open and geopolitical competition intensifies, expanding U.S. influence over Greenland helps ensure those resources remain aligned with Western supply chains rather than falling under Chinese or Russian control.
Step 4: Iran — Target China’s Other Discount Oil Supplier
If Venezuelan supply tightens, China’s next major source of discounted crude becomes Iran.
China buys the majority of Iranian oil exports through intermediaries and sanctions-evasion shipping networks, often at below-market prices. That relationship has been a key pillar of Beijing’s energy strategy, providing discounted supply outside Western financial systems.
The current escalation now threatens that flow — especially because the Strait of Hormuz normally carries about 20% of global oil shipments.
But Iran is also attempting to use the chokepoint as financial leverage. Tehran has signaled it may allow limited tanker traffic through the strait only if the cargo is traded in Chinese yuan rather than U.S. dollars.
If implemented, that would effectively tie limited access to Hormuz to yuan-denominated oil trade, challenging the dollar-based system that has long governed global energy markets.
That detail ties the conflict directly into a broader issue President Trump repeatedly emphasized: countering efforts by BRICS countries to weaken the dollar’s role in global commerce.
Step 5: Russia — Reposition the Swing Supplier
Russia has become one of the largest providers of discounted crude to China and India since Western sanctions reshaped global energy markets.
But recent developments suggest Washington may be trying to reshape that relationship rather than simply isolate Moscow indefinitely.
This week the United States issued a 30-day waiver allowing purchases of Russian oil currently stranded at sea, potentially affecting around 100 million barrels of crude.
The move is partly aimed at stabilizing markets after the Iran conflict disrupted shipping through the Strait of Hormuz.
But it also reflects a longer-term possibility: gradually reintegrating Russian energy into global markets in ways that reduce China’s privileged access to discounted supply.
If Russian barrels return more broadly to global markets instead of flowing primarily to Asia, Beijing loses one of its most important sources of cheap energy.


Kharg Island — The Physical Center of Iran’s Oil Exports
If the Strait of Hormuz is the narrow passage that most oil tankers must travel through, Kharg Island is the main port where Iran loads its oil onto those tankers.
This weekend, U.S. forces carried out a large bombing raid on the island, hitting military targets such as air defenses and naval facilities while deliberately avoiding the oil terminals that handle most of Iran’s exports.
Kharg sits about 15–20 miles off Iran’s coast and handles up to 90% of the country’s oil shipments by sea, making it the main gateway through which Iranian crude reaches global markets.
That’s why the strike matters. By hitting military infrastructure but leaving the oil facilities untouched, the United States showed it can pressure Iran’s export system without immediately removing millions of barrels of oil from the global market.
But it also sends a clear warning. If Iran continues to interfere with tanker traffic in the Strait of Hormuz, the U.S. now has the option of targeting the facilities on Kharg that load oil onto ships.
Put simply: the Strait of Hormuz controls the route oil travels, but Kharg Island controls whether Iran can export its oil at all.
That makes it one of the most important pieces of infrastructure in the entire conflict.

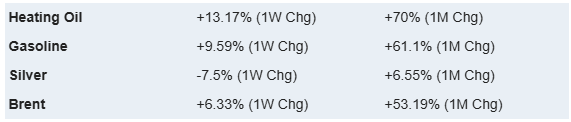
This chart shows that major energy shocks—such as Russia’s invasion of Ukraine and the current Middle East conflict—drive sharp spikes in oil prices that historically push fertilizer costs higher, which then ripple into global food prices as reflected in the FAO World Food Index
Second-Order Effects — Fertilizer and Aluminum
The economic impact of the conflict is already spreading beyond oil.
One of the first sectors feeling the shock is fertilizer, which relies heavily on energy. Natural gas is a key ingredient used to produce nitrogen fertilizers, so when energy prices rise, fertilizer prices usually rise as well. At the same time, the Strait of Hormuz is a major shipping route for about one-third of the world’s fertilizer trade, meaning disruptions there can tighten supply just as farmers in the Northern Hemisphere are preparing for spring planting.
Prices for key fertilizer ingredients like urea, ammonia, sulphur, and phosphates are already moving higher as shipping risks and energy costs ripple through agricultural markets.
That dynamic could benefit large fertilizer producers such as Mosaic (MOS), CF Industries (CF), and Nutrien (NTR), which are major suppliers of potash and nitrogen fertilizers.
Industrial metals are now starting to feel the pressure as well.
On Sunday, the world’s largest single-site aluminum smelter in the Middle East — Aluminium Bahrain (Alba) — cut production by roughly 20% because shipping through the Strait of Hormuz has been heavily disrupted. That reduction represents about 2.2% of global aluminum supply, showing how quickly the conflict is beginning to impact industrial production.
Aluminum production requires enormous amounts of electricity, so energy disruptions and shipping bottlenecks can quickly tighten supply and push prices higher.
That environment can benefit U.S. producers like Alcoa (AA) and Century Aluminum (CENX) if global aluminum prices continue rising.
Taken together, these developments show the conflict is no longer just an oil story.
Energy disruptions are now spreading into fertilizer, industrial metals, food production, and supply chains, widening the economic impact of the crisis far beyond the energy market itself.

Stress Is Spreading in the Private Credit Market
Another area investors are watching closely is the private credit market — a fast-growing part of the financial system where large investment funds lend directly to companies instead of banks.
Several major firms have already restricted or halted withdrawals after investors rushed to pull money out. Funds connected to BlackRock, Blackstone, Morgan Stanley, Blue Owl, and Cliffwater have nearly all imposed redemption limits in recent months. For example, Morgan Stanley capped withdrawals at 5% of shares in one of its private income funds after redemption requests exceeded 10%, while Blue Owl halted redemptions in a technology-focused lending fund.
These restrictions matter because they reveal a key weakness in private credit: many of the loans cannot be easily sold. Unlike stocks or bonds that trade every day, private loans often sit on balance sheets for years. If too many investors want their money back at once, managers may be forced to freeze withdrawals or sell loans at steep discounts.
If that cycle accelerates, it can start to resemble a “run on the bank.” Investors see redemption limits and rush to withdraw funds before they are locked out, which forces managers to sell assets quickly and pushes loan prices even lower.
Part of the concern is where much of this money was lent. Software and technology companies became one of the largest sectors financed by private credit over the past decade, accounting for roughly 20–25% of the market because lenders liked their recurring subscription revenue.
Now that valuations are falling and artificial intelligence is disrupting parts of the software industry, many of those loans are becoming riskier.
Public software companies most exposed to tighter credit conditions include:
- Snowflake (SNOW)
- MongoDB (MDB)
- Datadog (DDOG)
- Cloudflare (NET)
- Okta (OKTA)
- GitLab (GTLB)
- Elastic (ESTC)
These companies often rely heavily on debt financing, venture funding, or private-equity-backed credit to fund expansion. If private credit tightens, it becomes harder and more expensive for them to refinance loans or raise new capital.
At the same time, the firms most directly exposed to stress in the lending market include private-credit managers such as:
- Blackstone (BX)
- Ares Management (ARES)
- Apollo Global Management (APO)
- Blue Owl Capital (OWL)
If redemption pressure continues, the result could be forced loan sales, falling valuations, and tighter credit across private equity and software companies, spreading stress beyond private credit itself.
Last's Weeks Sector Winners & Losers
Sector performance last week showed broad market weakness, with only one sector finishing higher.
Energy (XLE) was the lone gainer, rising +1.82%, supported by the surge in crude prices amid escalating tensions in the Middle East.
Losses were widespread across the rest of the market. Utilities (XLU) fell –0.85%, while Consumer Staples (XLP) declined –1.36%.
Technology and communication stocks also weakened, with Information Technology (XLK) down –1.67% and Communication Services (XLC) falling –2.68%.
More economically sensitive sectors saw deeper losses. Materials (XLB) dropped –2.26%, Health Care (XLV) declined –2.44%, and Real Estate (XLRE) fell –2.77%.
The sharpest declines came from Industrials (XLI) down –3.96%, Consumer Discretionary (XLY) down –4.32%, and Financials (XLF) down –4.68%, making financials the worst-performing sector of the week.
Overall, the pattern suggests investors shifted toward energy exposure tied to geopolitical risk while broadly reducing risk across most other sectors.

Upcoming Events This Week
This week will focus on the Middle East conflict, global monetary policy decisions, and key economic data, all of which could shape expectations for interest rates and energy markets.
The Federal Reserve meeting will be the main event, with policymakers widely expected to keep the federal funds rate steady at 3.50%–3.75%. Investors will be closely watching the Fed’s updated economic projections and Chair Jerome Powell’s press conference for clues on how officials are assessing inflation risks tied to rising energy prices and geopolitical tensions in the Middle East.
Markets will also track several important economic releases, including February’s Producer Price Index (PPI) and industrial production data, which will provide signals about inflation pressures and the strength of U.S. manufacturing. Additional indicators such as pending home sales, regional manufacturing surveys, factory orders, and new home sales will offer further insight into economic momentum.
Globally, attention will extend beyond the U.S. as major central banks including the European Central Bank, Bank of Japan, Bank of England, Swiss National Bank, Reserve Bank of Australia, Bank of Canada, and Sweden’s Riksbank hold policy meetings. Investors will also watch China’s economic data, including industrial production, retail sales, unemployment, housing prices, and fixed-asset investment, for signs of how the world’s second-largest economy is performing.
The key question for markets: How will central banks balance inflation risks from higher energy prices with signs of slowing economic growth?
On the corporate side, Nvidia’s annual GTC conference will draw significant attention, as investors look for new insights into the next phase of AI infrastructure and semiconductor demand.

Company News
LevelFields AI Stock Alerts Last Week
Zevra Therapeutics (ZVRA) +21.3% — Celiprolol Wins Key FDA Designations
Zevra Therapeutics jumped 21.3% in one day after announcing that Celiprolol received both Orphan Drug and Breakthrough Therapy designations from the U.S. FDA.
The designations are important because they can help speed development and review while also strengthening the commercial outlook if the drug is approved. Investors reacted positively because the update signals growing regulatory support for Celiprolol and improves the odds that the program could move forward more quickly.
Karat Packaging (KRT) +21% — Strong Earnings + Buyback
Karat Packaging rose 21% after reporting strong Q4 and full-year 2025 results, including record fourth-quarter sales of $115.6 million, up 13.7% year over year, while net income climbed 22.8% to $7.2 million.
The report also showed that the company is still growing profitably despite tariff pressure, with management guiding for continued sales growth and improving margins in 2026. Investors were further encouraged by the company’s shareholder return story, as Karat disclosed that $12.0 million remains available under its share repurchase program, signaling flexibility to keep buying back stock while the business expands.

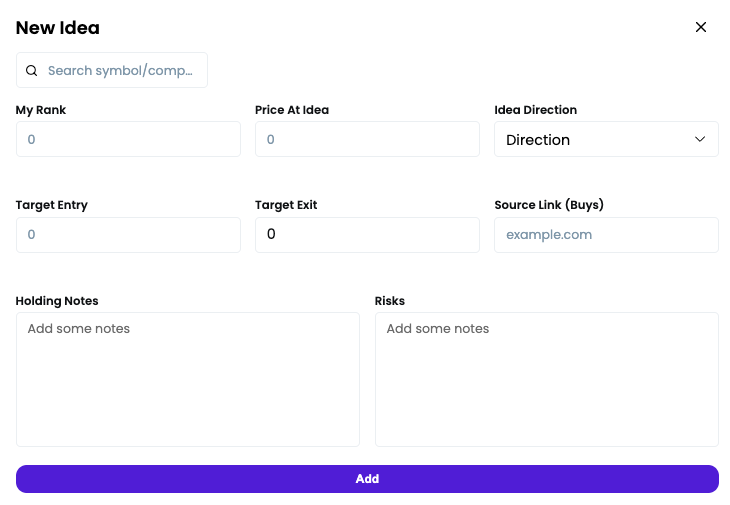
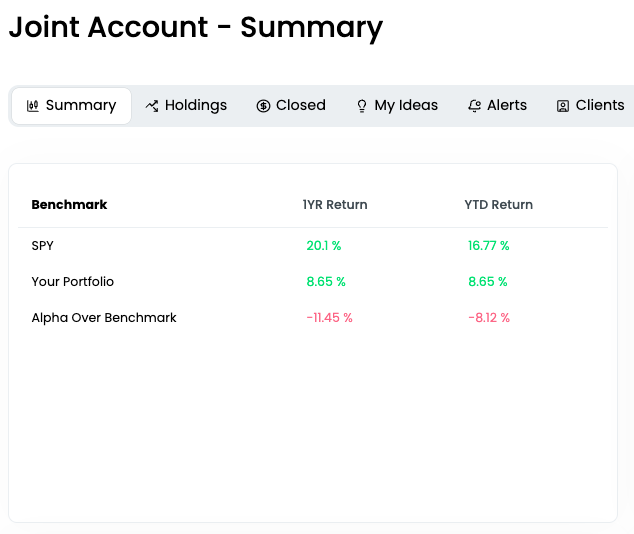
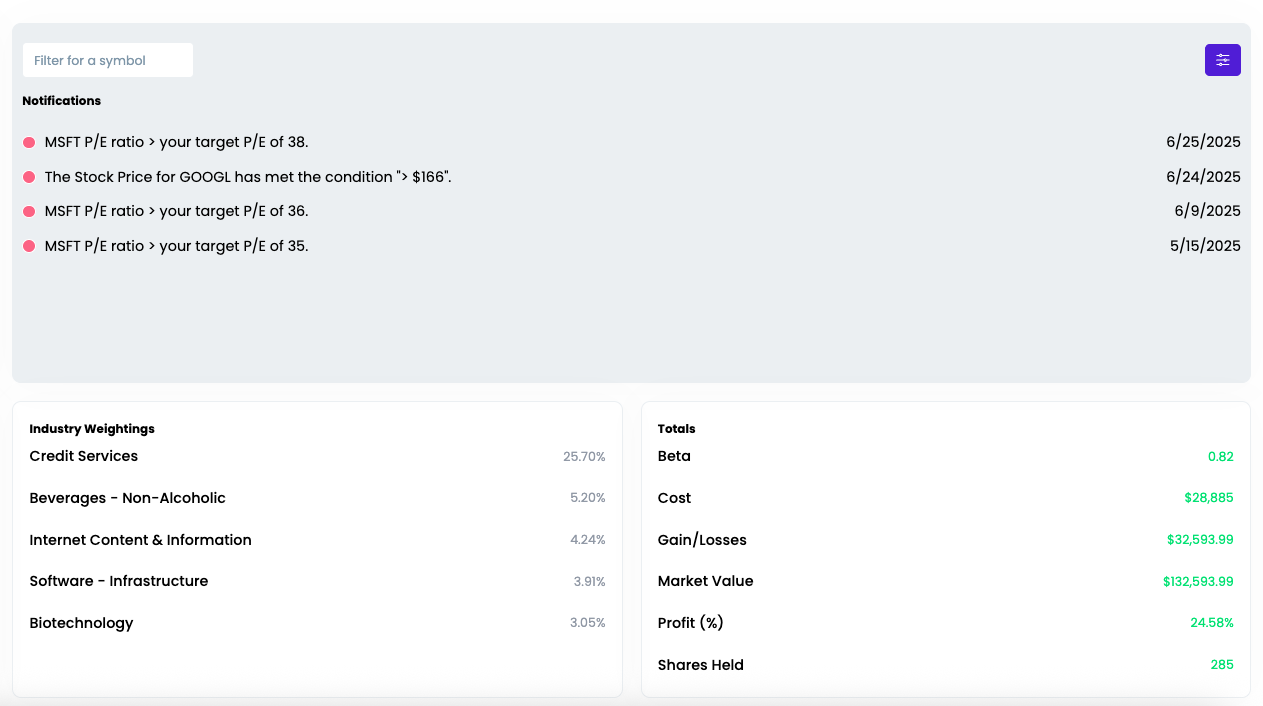
Introducing the LevelFields Portfolio Tracker
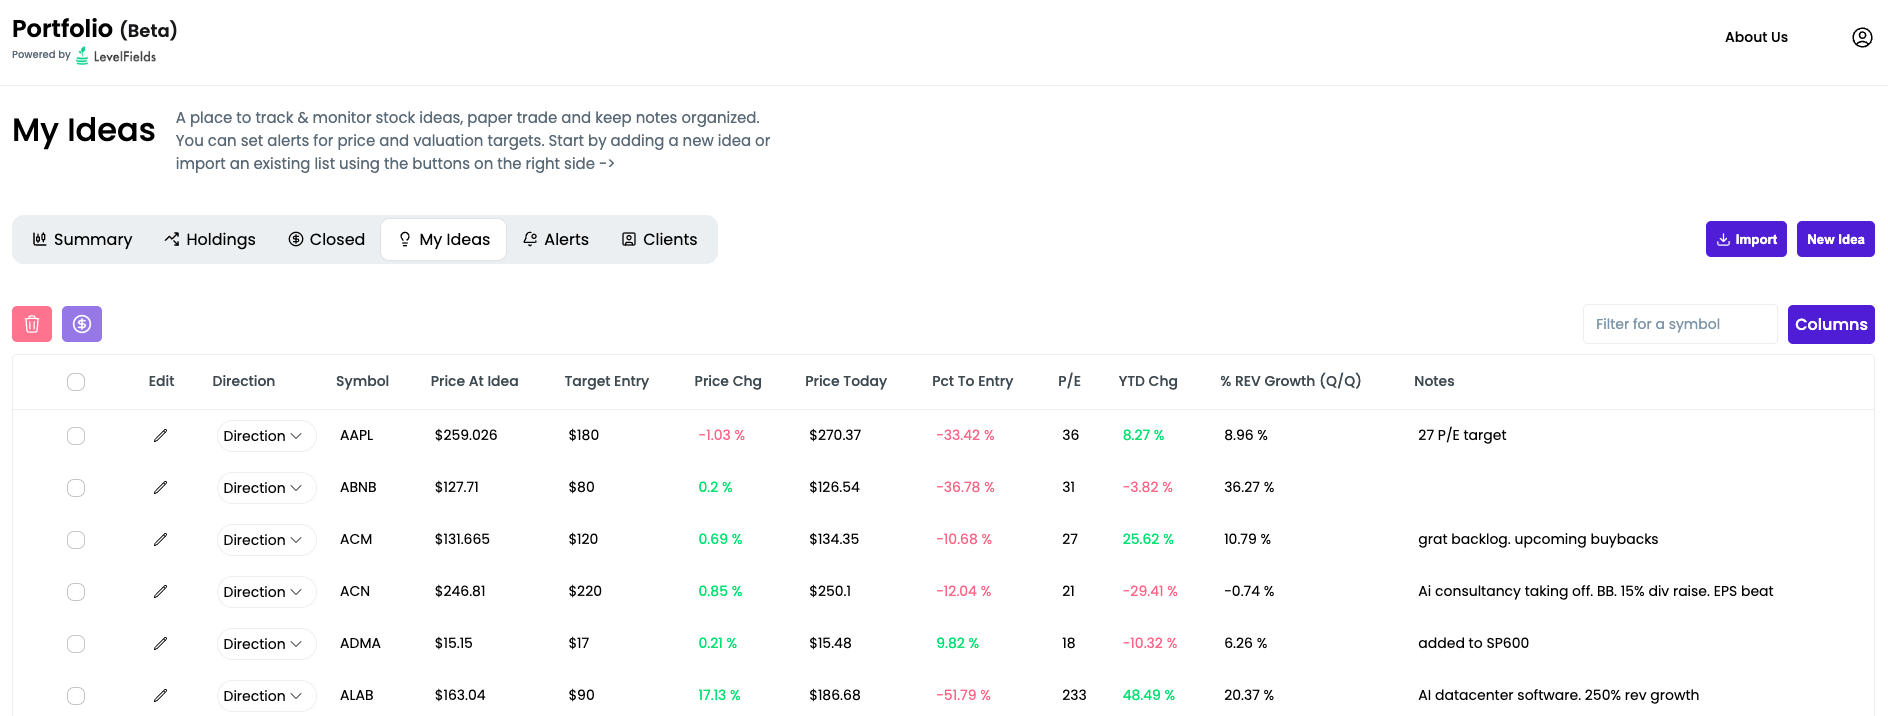
We’ve just launched the new LevelFields Portfolio platform — a centralized dashboard built for active investors and wealth managers to track their trades, organize trade ideas, and monitor real or prospective portfolios.
We've replaced Excel and Google Sheets trade tracking with software that updates as prices and valuations of stocks change, so you don't lose money by missing great entry and exit points.
You can sign up for free!
What it does:
- Lets you add both real positions and idea-stage trades into one unified portfolio.
- Tracks allocation, profit/loss, KPIs, P/E, price targets, and thesis notes in one place.
- Allows you to set real-time alerts on valuation changes, price moves, and price targets using bulk editing (e.g. one alert for all holdings).
- Lets you toggle any ticker between “Idea → Holding → Closed” while preserving the original trade thesis and exit notes.
- Designed for traders, advisors, and fund managers who need a live, organized view of positions + rationale, not just a static spreadsheet of tickers.
- Import CSV file of existing ideas, notes, and portfolio holdings for a quick start
- Keep track of reasons you bought and sold to analyze your performance and for compliance
- Design your own model portfolios based on allocations, sector, and industry
-

.png)
How to use LevelFields for Options Trading
Tracking Stocks Without Spreadsheets
The Truth About Dividend Stocks
What's LevelFields' Premium Membership Provide?