


.png)

L2 Weekly Stock Market News Analysis
March 29th, 2026
Image Above:
The Nasdaq-to-gold ratio is now back at levels that have historically marked periods of peak fear—when investors crowd into safety and abandon growth—and those moments have consistently aligned with major turning points for equities.
While past performance doesn’t guarantee future results, extreme lows in stock-to-gold ratios have often signaled that risk is already priced in, creating asymmetric upside if macro conditions stabilize and capital rotates back into growth.

TLDR:
Markets head into the coming week with the story shifting from initial shock to sustained pressure. The selloff is no longer just about headlines—it is now being reinforced by technical breakdowns, persistent energy-driven inflation risk, and early signs of slowing growth.
Equities have clearly lost their footing. Major indices have broken below key support levels, with five consecutive weeks of declines marking one of the longest losing streaks in decades. More importantly, market behavior has changed—rallies are being sold rather than bought, signaling a shift toward de-risking across both discretionary and systematic investors.
At the center of this move remains oil. Prices have surged alongside the escalation in the Middle East, but unlike past shocks, the move is not yet at historical extremes. That leaves markets caught between two outcomes: either the current spike fades with de-escalation, or a more severe energy shock still lies ahead if disruptions through the Strait of Hormuz persist.
At the same time, incoming data is beginning to confirm the second-order effects. Growth is slowing while cost pressures are building. Job openings continue to decline, hiring is becoming more cautious, and higher energy costs are starting to feed through into services like transportation and air travel. This combination points toward a more stagflationary backdrop—where inflation remains sticky even as economic momentum weakens.
Sector performance reflects that shift. Energy remains the only clear area of strength, while weakness has broadened across both cyclicals and defensives. This is no longer a rotation—it is a reduction in overall exposure, with investors pulling back as macro uncertainty rises.
The key question this week is whether markets stabilize as positioning resets, or whether pressure builds further if oil remains elevated and economic data continues to deteriorate.
Markets Break Down as Oil Shock Meets Technical Damage
Markets extended their decline this week, marking five consecutive weeks of losses—a rare stretch only seen a handful of times since the 1970s. The Nasdaq remains in correction territory, the Dow has now followed with a 10% drawdown from its highs, and the S&P 500 has decisively broken below its 200-day moving average. The short-term trend has also rolled over, with the 21-day crossing below the 200-day—what technicians refer to as a “light death cross.”
What matters more than the headline levels is how the market is behaving around them.
In stronger environments, a break below the 200-day tends to trigger buying and short covering. In weaker environments, it does the opposite—investors sell into weakness and reduce exposure. That shift is now clearly underway. Instead of stabilizing, downside momentum has accelerated, with persistent selling into rallies and continued de-risking across hedge funds and systematic strategies.

At the same time, this is not a typical selloff driven by earnings or a growth scare. It is being driven by a macro shock centered around energy.
Image below shows 165 years of oil price spikes, with every major surge tied to a specific geopolitical or economic event—from the Civil War to the 2008 financial crisis. The current 2026 spike is notable but still smaller than past shocks like 1980 and 2003, suggesting either a faster resolution or that a larger move in oil may still be ahead.

Oil is now following a pattern seen repeatedly across history—each major spike tied to a geopolitical or economic event: the Civil War, the Arab Oil Embargo, the Iranian Revolution, the Gulf War, and the 2008 financial crisis. The current move sits within that same framework. What stands out, however, is that despite the escalation in the Middle East, the price response so far remains below the peaks seen in 1980 and 2003.
That creates a clear fork in the road. Either the market is correctly anticipating a relatively quick resolution, or it is underpricing the risk and the more severe phase of the energy shock has yet to occur. Historically, every one of these spikes eventually resolved—but not before contributing to economic slowdowns or outright recessions.
This dynamic is now dominating equities. Markets are no longer trading primarily on earnings or Federal Reserve expectations—they are reacting to oil, geopolitical escalation, and positioning flows. With hedge funds cutting exposure aggressively and systematic selling intensifying, positioning is now significantly lighter.
Images Below: The first chart shows inflation data coming in stronger than expected while growth data weakens, signaling rising price pressures alongside slowing economic momentum. The second chart highlights how oil prices are already spiking in response to the conflict, similar to past geopolitical shocks. Together, they point to a clear chain: a longer war drives higher oil and fuel costs, which feeds into inflation while simultaneously weighing on growth—creating a more stagflationary backdrop.


Conflict Expands as Diplomacy Stalls and Trade Risks Build
This week showed that a near-term resolution is becoming less likely, even as both sides continue to signal openness to talks.
Early in the week, markets reacted to headlines suggesting potential progress in negotiations. That optimism faded as messaging diverged—U.S. officials indicated a willingness to engage, while Iranian officials pushed back on the idea that meaningful talks were underway. Rather than a clear diplomatic path forming, what emerged was conflicting positioning without concrete movement toward resolution. Deadlines continue to be extended, but core disagreements remain unresolved, including sanctions relief, security guarantees, and control over key shipping routes .
The key shift is not that diplomacy has ended, but that there is still no clear framework or timeline for de-escalation, increasing the likelihood that the conflict persists longer than initially expected. From Iran’s perspective, the conflict carries regime-level implications, which makes near-term concessions less likely and shifts the timeline from weeks to potentially months .
At the same time, the structure of the conflict continues to evolve. Iranian-backed groups—particularly the Houthis—are playing a larger and more coordinated role, turning this into a multi-front system with decentralized pressure points. Combined with troop buildups and the potential for additional regional involvement, the risk is less about a single escalation event and more about a gradual broadening of the conflict footprint.
The focus this week moved beyond whether shipping is at risk—which has already been established—to how sustained and controllable those disruptions actually are. Iran has the ability to disrupt the Strait of Hormuz for extended periods using low-cost, asymmetric methods like drones, mines, and small attack vessels—tools that are difficult to fully eliminate without a much larger military commitment . At the same time, renewed threats in the Red Sea introduce a second layer of disruption, increasing the probability that both key trade corridors face pressure simultaneously.
That combination shifts the issue from short-term disruption to structural strain on global trade flows. It is not just about longer routes or higher costs—it is about reduced reliability, tighter supply chains, and growing pressure on refined products, where shortages are already emerging and countries are beginning to restrict exports to protect domestic supply .
Markets are beginning to reflect this shift. Rather than reacting to isolated headlines, pricing is starting to incorporate the possibility that energy and trade disruptions persist longer than expected, with broader implications for inflation, growth, and policy going forward.

Slowing Growth Meets Rising Costs as Economic Pressure Builds
Beneath the geopolitical headlines, this week’s data continues to point in the same direction: growth is losing momentum while cost pressures are picking back up.
The labor market is gradually cooling. Job openings—especially in higher-paying sectors like professional and business services—have fallen meaningfully from their peak, and hiring has become more uneven. Companies are no longer expanding aggressively; instead, they are slowing hiring and focusing on cost control.
At the same time, price pressures tied to energy are starting to show up more clearly in the real economy. The recent surge in airfares across major international routes is one example of how quickly higher fuel costs are being passed through, reinforcing the risk that inflation stabilizes at higher levels rather than continuing to move lower.
Growth data is softening alongside this. Manufacturing has been relatively stable, but services activity is weakening, and overall economic growth is tracking closer to low single-digit levels. Businesses are responding by becoming more cautious—adjusting inventories, managing expenses, and preparing for a more uncertain demand environment.
This creates a difficult backdrop. Slower growth would typically support easier policy, but persistent cost pressures—particularly from energy—limit that flexibility.
At the same time, stress is building quickly in credit markets. Tighter financial conditions and higher borrowing costs are starting to expose weaker areas, particularly in private credit and less liquid parts of the market that have relied on steady flows and stable valuations.
In this environment, the focus shifts toward resilience. Companies with strong balance sheets, pricing power, or direct exposure to energy and infrastructure tend to hold up better—names like Civitas Resources (CIVI) and HF Sinclair (DINO) benefit from higher energy and fuel margins, while Powell Industries (POWL) and Broadcom (AVGO) are supported by infrastructure and long-term demand. More defensive or non-cyclical names such as Coca-Cola Consolidated (COKE) and Fidelity National Financial (FNF) also remain relatively insulated.
Likely to Hold Up Better
- CIVI (Civitas Resources) — Mid-cap oil producer with strong free cash flow; directly benefits as higher oil prices flow through to revenue and margins
- DINO (HF Sinclair) — Refiner with integrated logistics; rising fuel prices and refining spreads support profitability
- FTAI (FTAI Aviation) — Aircraft leasing and engine services; higher airfares and capacity constraints increase demand for leased aircraft and maintenance
- AVGO (Broadcom) — Strong pricing power and long-term enterprise contracts; less exposed to short-term macro swings
- FNF (Fidelity National Financial) — Fee-based title business with stable cash flows and strong capital position, less sensitive to economic volatility
- COKE (Coca-Cola Consolidated) — Non-discretionary consumer demand with pricing power; can pass through higher input costs
- POWL (Powell Industries) — Electrical infrastructure provider; benefits from continued energy and grid investment regardless of broader slowdown
- VKTX (Viking Therapeutics) — Biotech with no debt and catalyst-driven pipeline; performance less tied to macro conditions
Tickers Likely to Face Pressure
- BOWL (Bowlero) — Consumer entertainment with leverage; discretionary spending typically weakens first in slowdowns
- PRCH (Porch Group) — Housing and insurance exposure with a weaker balance sheet; pressured by higher rates and slowing activity
- COOK (Traeger) — Big-ticket discretionary consumer goods; demand already soft and sensitive to tightening conditions
- JOBY (Joby Aviation) — Pre-revenue and cash-burning; dependent on favorable capital markets that are now tightening
- BLND (Blend Labs) — Mortgage tech platform; directly impacted by higher rates and declining housing volumes
- XPOF (Xponential Fitness) — Subscription-based fitness model; consumers cut recurring expenses as budgets tighten
- RELY (Remitly) — Tied to cross-border consumer flows; sensitive to labor market softening
Last's Weeks Sector Winners & Losers
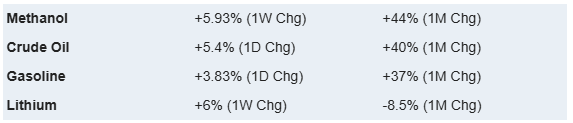
Sector performance last week reflected broad-based weakness with a narrow pocket of strength, led almost entirely by energy.
Energy (XLE) was the clear outperformer, rising +3.64%, followed by Materials (XLB) up +2.83%, as commodity exposure benefited from rising oil and input costs. Financials (XLF) were essentially flat, up +0.12%, showing relative stability but little conviction.
Losses were widespread across the rest of the market. Technology (XLK) led declines, falling -4.28%, alongside Communication Services (XLC) down -3.83% and Real Estate (XLRE) off -3.89%. Utilities (XLU) also sold off sharply, down -2.60%, while Industrials (XLI) declined -1.70%.
Consumer-facing sectors remained under pressure, with Consumer Discretionary (XLY) down -0.79% and Consumer Staples (XLP) falling -1.01%, while Health Care (XLV) held up relatively better, down just -0.59%.
Overall, the pattern reinforces a market rotating toward energy and hard assets, while growth, rate-sensitive sectors, and defensives all weakened—highlighting how concentrated leadership has become in the current environment.

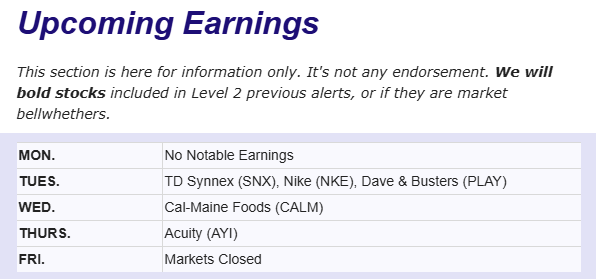
Upcoming Events This Week
This week remains focused on Middle East developments and energy markets, with investors watching for any signs of de-escalation after the U.S. delayed further attacks. Ongoing disruption around the Strait of Hormuz continues to pose a risk to global growth.
In the U.S., a shortened week will be headlined by Friday’s jobs report, expected to show a modest payroll rebound alongside a slight rise in unemployment. The ISM Manufacturing survey and JOLTs data will provide further insight into how higher energy costs are impacting business activity and labor demand.
Globally, the Eurozone’s first inflation print since the conflict will be key in assessing pass-through from energy prices, while China’s PMIs will offer an early read on growth in the world’s largest energy importer. Central bank updates from the BoJ, RBA, and BoC will also be in focus as policymakers navigate rising inflation pressures alongside slowing growth.

Company News
LevelFields AI Stock Alerts Last Week
The Lovesac Company (LOVE) +21% — Earnings Strength + Buyback Expansion
Lovesac surged 21% in one day following its latest earnings report, alongside a major capital return announcement. The company authorized an additional $40 million share repurchase, bringing its total buyback program to approximately $54.1 million.
Investors reacted positively as the combination of strong earnings and an expanded buyback signals management confidence in both cash flow and forward demand. In the current environment—where markets are rewarding profitability and capital discipline—Lovesac’s move reinforces a shift toward shareholder returns over aggressive expansion, helping drive the sharp upside move.
Braze (BRZE) +20% — Strong Growth + $100M Buyback
Braze surged ~20% in one day following its latest earnings report and a major buyback announcement. The company authorized a $100 million share repurchase program, including a $50 million accelerated buyback.
Braze provides a customer engagement platform that helps companies send personalized messages, notifications, and marketing campaigns across apps, email, and other digital channels.
Investors reacted positively as the earnings showed continued strong revenue growth and improving operating leverage, alongside clear momentum in enterprise adoption tied to AI-driven customer engagement. In the current environment—where markets are rewarding both growth and a path to profitability—the buyback signals confidence in cash generation and valuation, reinforcing Braze’s shift from a pure growth story toward a more balanced growth + profitability profile.
.png)
How to use LevelFields for Options Trading
Tracking Stocks Without Spreadsheets
The Truth About Dividend Stocks
What's LevelFields' Premium Membership Provide?
This is not financial advice. All information represent opinions only for informational purposes. Given the vast number of stocks we cover in these reports, assume staff covering stocks have positions in stocks discussed.
Have feedback or a request for specific data? Drop us a note at support@levelfields.ai